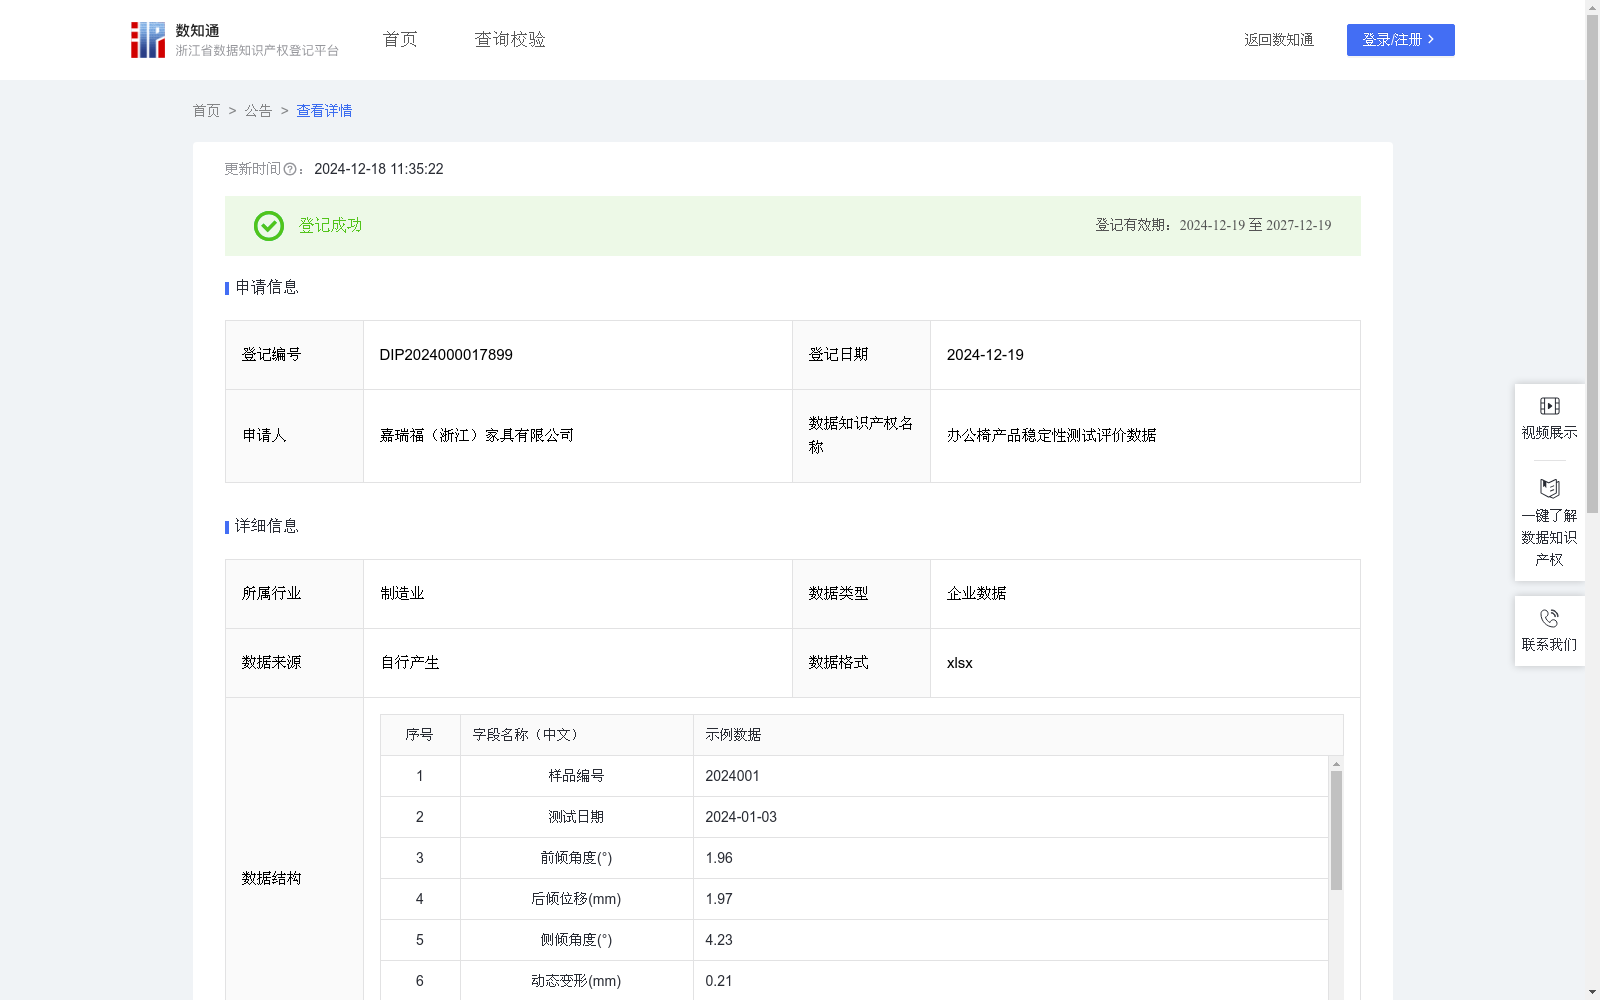
办公椅产品稳定性测试评价数据
收藏浙江省数据知识产权登记平台2024-12-18 更新2024-12-19 收录
下载链接:
https://www.zjip.org.cn/home/announce/trends/106626
下载链接
链接失效反馈官方服务:
资源简介:
办公椅产品稳定性测试评价数据在产品研发和质量控制中具有重要应用价值。通过标准化的测试方法收集的数据,不仅能够直接用于评估产品的稳定性和安全性,还可以指导产品设计优化和质量改进。相关评价数据能够帮助制造商建立完善的质量控制标准,为产品研发提供可靠的技术支持。这些数据可以作为行业基准,帮助不同制造商进行产品性能比对和改进。同时,累积的测试数据还可以支持行业标准的制定和完善,推动整个办公家具行业的质量提升。通过持续的数据收集和分析,我们不仅能够预测产品在实际使用中可能出现的问题,还能及时发现和解决潜在的安全隐患。这些数据的积累和共享将有助于推动行业技术创新,提升产品整体品质,最终实现行业的可持续发展。1.数据采集:收集办公椅产品的稳定性测试结果数据,包括以下内容:(1)数据采集:收集办公椅产品的稳定性测试结果数据,包括样品编号、测试日期、前倾角度(°)、后倾位移(mm)、侧倾角度(°)、动态变形(mm)、制动滑距(mm)。
2. 评分标准
2.1 测试项目边界值设定
1)前倾角度(°):优秀上限2°、良好上限4°、一般上限6°。2)后倾位移(mm):优秀上限:优秀上限2mm、良好上限4mm、一般上限6mm。3)侧倾角度(°):优秀上限4°、良好上限6°、一般上限8°。4)动态变形(mm):优秀上限:优秀上限1mm、良好上限2mm、一般上限3mm。5)制动滑距(mm):优秀上限1mm、良好上限2mm、一般上限3mm。
2.2 得分计算公式
根据测量值所在区间,使用以下公式计算各项得分:
1)优秀区间 (测量值 ≤ 优秀上限):得分 = 90 + (优秀上限 - 测量值) × 10 / 优秀上限。2)良好区间 (优秀上限 < 测量值 ≤ 良好上限):得分 = 80 + (良好上限 - 测量值) × 10 / (良好上限 - 优秀上限)。3)一般区间 (良好上限 < 测量值 ≤ 一般上限):得分 = 60 + (一般上限 - 测量值) × 20 / (一般上限 - 良好上限)。4)较差区间 (测量值 > 一般上限):得分 = max(0, 60 - (测量值 - 一般上限) × 10)。
3. 综合评级判定
根据平均分和最低分,按以下标准判定综合评级:
优秀:平均分 ≥ 90 分且 最低分 ≥ 85 分。
良好:平均分 ≥ 80 分且 最低分 ≥ 70 分。
一般:平均分 ≥ 60 分且 最低分 ≥ 50 分。
较差:不满足以上任何条件。
Data on the stability test and evaluation of office chair products holds significant application value in product R&D and quality control. Data collected via standardized test methods can not only directly assess product stability and safety, but also guide product design optimization and quality improvement. Relevant evaluation data can help manufacturers establish comprehensive quality control standards and provide reliable technical support for product development. These data can serve as industry benchmarks, enabling different manufacturers to compare product performance and carry out improvements. Meanwhile, accumulated test data can also support the formulation and refinement of industry standards, promoting quality enhancement across the entire office furniture industry. Through continuous data collection and analysis, we can not only predict potential issues of products during actual use, but also timely detect and resolve potential safety hazards. The accumulation and sharing of such data will facilitate technological innovation in the industry, improve overall product quality, and ultimately achieve sustainable development of the industry.
1. Data Collection: Collect stability test result data of office chair products, including the following contents: sample number, test date, forward tilt angle (°), backward tilt displacement (mm), lateral tilt angle (°), dynamic deformation (mm), braking sliding distance (mm).
2. Scoring Criteria
2.1 Test Item Boundary Value Setting
1) Forward tilt angle (°): Excellent upper limit 2°, Good upper limit 4°, Fair upper limit 6°. 2) Backward tilt displacement (mm): Excellent upper limit 2mm, Good upper limit 4mm, Fair upper limit 6mm. 3) Lateral tilt angle (°): Excellent upper limit 4°, Good upper limit 6°, Fair upper limit 8°. 4) Dynamic deformation (mm): Excellent upper limit 1mm, Good upper limit 2mm, Fair upper limit 3mm. 5) Braking sliding distance (mm): Excellent upper limit 1mm, Good upper limit 2mm, Fair upper limit 3mm.
2.2 Scoring Calculation Formula
According to the interval where the measured value falls, calculate the score for each item using the following formulas:
1) Excellent interval (measured value ≤ excellent upper limit): Score = 90 + (excellent upper limit - measured value) × 10 / excellent upper limit. 2) Good interval (excellent upper limit < measured value ≤ good upper limit): Score = 80 + (good upper limit - measured value) × 10 / (good upper limit - excellent upper limit). 3) Fair interval (good upper limit < measured value ≤ fair upper limit): Score = 60 + (fair upper limit - measured value) × 20 / (fair upper limit - good upper limit). 4) Poor interval (measured value > fair upper limit): Score = max(0, 60 - (measured value - fair upper limit) × 10).
3. Comprehensive Rating Determination
According to the average score and the lowest score, determine the comprehensive rating according to the following standards:
Excellent: Average score ≥ 90 points and lowest score ≥ 85 points.
Good: Average score ≥ 80 points and lowest score ≥ 70 points.
Fair: Average score ≥ 60 points and lowest score ≥ 50 points.
Poor: Does not meet any of the above conditions.
提供机构:
嘉瑞福(浙江)家具有限公司
创建时间:
2024-12-01
搜集汇总
数据集介绍
特点
该数据集包含501条办公椅产品稳定性测试评价数据,涵盖多个测试项目及其得分和综合评级,数据格式为xlsx,每季度更新一次。数据主要用于产品研发和质量控制,帮助制造商优化设计、建立质量控制标准,并支持行业标准的制定和完善。
以上内容由遇见数据集搜集并总结生成


