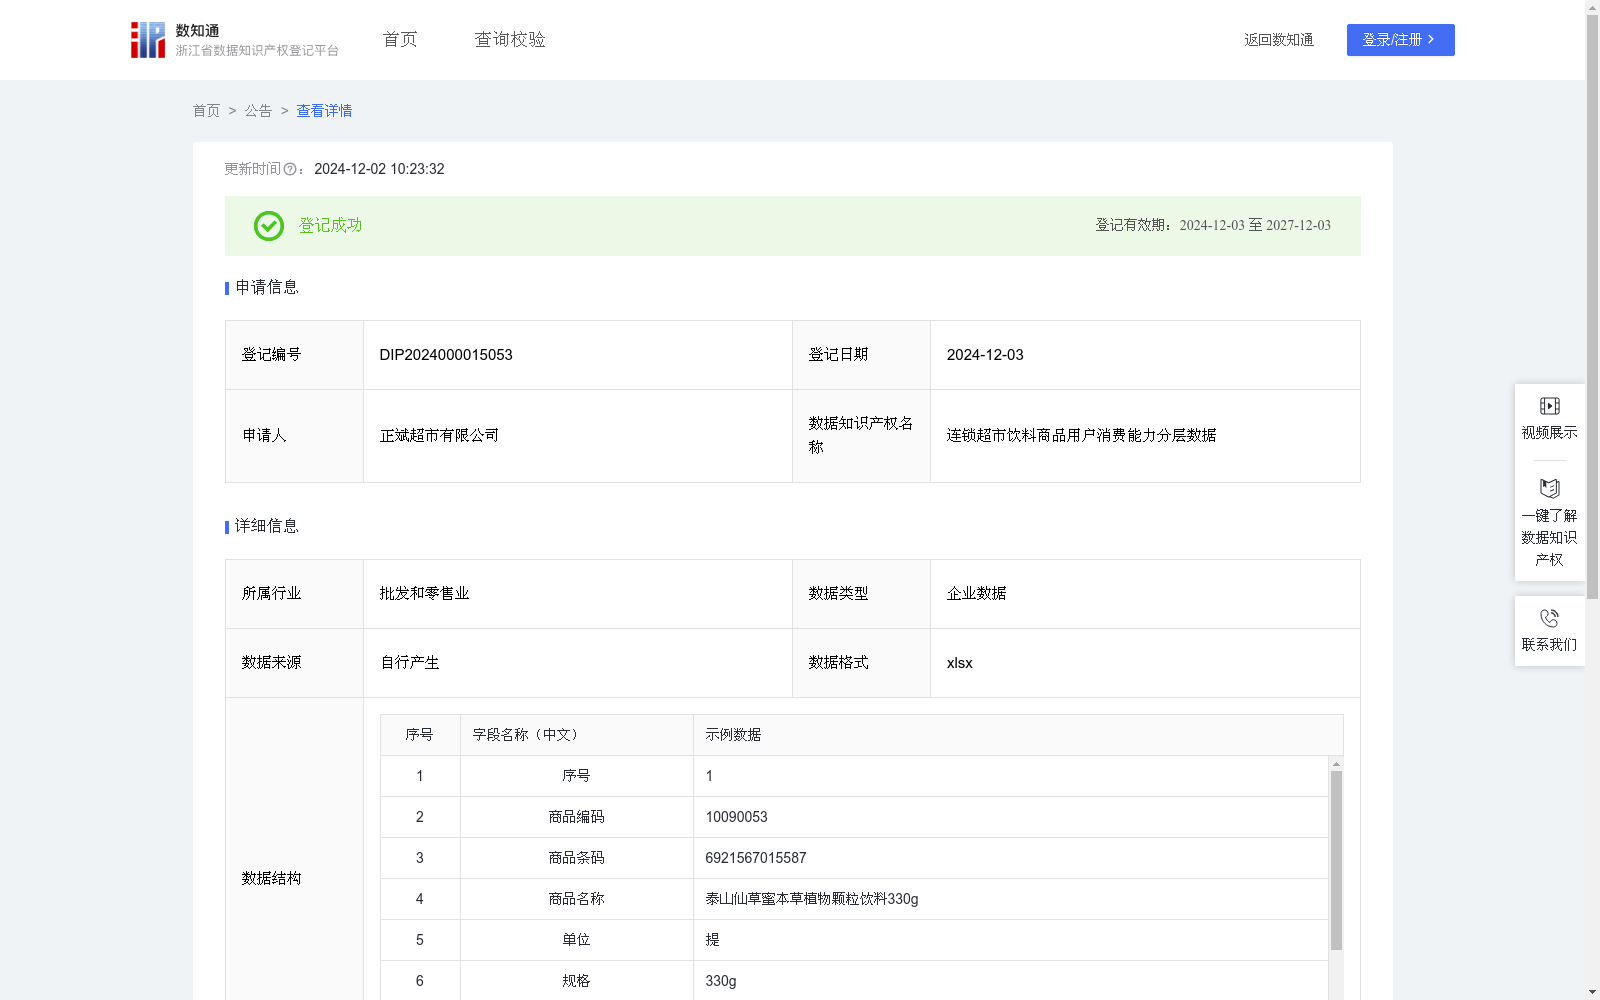
连锁超市饮料商品用户消费能力分层数据
收藏资源简介:
通过对历史下单用户收集数据分析,了解该地区客户对饮料商品的消费情况,对用户进行标签制定,定位用户消费级别,了解客户对饮料口味的消费偏好,从而了解该产品是否畅销,为本地区的所有批发、零售行业制定采购、销售策略,更好地为用户提供个性化的商品和服务。1、用户消费饮料商品数量占总消费饮料商品数量的比例=用户消费饮料商品数量/总消费饮料商品数量*100%;2、用户消费占总消费的比例按从大到小进行排名;3、消费分类运用ABCDEFGH分类法,对占比大于等于7%以上的,给予“A类消费”分层;占比大于等于6%到小于7%区间的,则给予“B类消费”分层;占比在大于等于5%到小于6%区间,则给予“C类消费”分层。占比在大于等于4%到小于5%区间,则给予“D类消费”分层;占比在大于等于3%到小于4%区间,则给予“E类消费”分层;占比在大于等于2%到小于3%区间,则给予“F类消费”分层;占比在大于等于1%到小于2%区间,则给予“G类消费”分层;占比在小于1%以下,则给予“H类消费”分层。
This dataset analyzes data collected from historical order users to achieve the following goals: understand the beverage consumption status of customers in this region, develop user consumption tags and classify user consumption tiers, ascertain customers' consumption preferences for beverage flavors, evaluate the marketability of the products, formulate procurement and sales strategies for all local wholesale and retail industries, and better provide users with personalized products and services. 1. The proportion of a user's beverage consumption volume in the total regional beverage consumption volume = (User's individual beverage consumption volume / Total regional beverage consumption volume) × 100%; 2. Rank all users in descending order according to their consumption proportions; 3. Adopt the ABCDEFGH classification method for consumption tiering: categorize users with a proportion ≥7% as "Class A Consumption"; users with a proportion ranging from 6% (inclusive) to 7% (exclusive) as "Class B Consumption"; users with a proportion ranging from 5% (inclusive) to 6% (exclusive) as "Class C Consumption"; users with a proportion ranging from 4% (inclusive) to 5% (exclusive) as "Class D Consumption"; users with a proportion ranging from 3% (inclusive) to 4% (exclusive) as "Class E Consumption"; users with a proportion ranging from 2% (inclusive) to 3% (exclusive) as "Class F Consumption"; users with a proportion ranging from 1% (inclusive) to 2% (exclusive) as "Class G Consumption"; and users with a proportion less than 1% as "Class H Consumption".