第三方医学检验机构产品销售状况分析数据
收藏浙江省数据知识产权登记平台2024-10-09 更新2024-10-10 收录
下载链接:
https://www.zjip.org.cn/home/announce/trends/68562
下载链接
链接失效反馈官方服务:
资源简介:
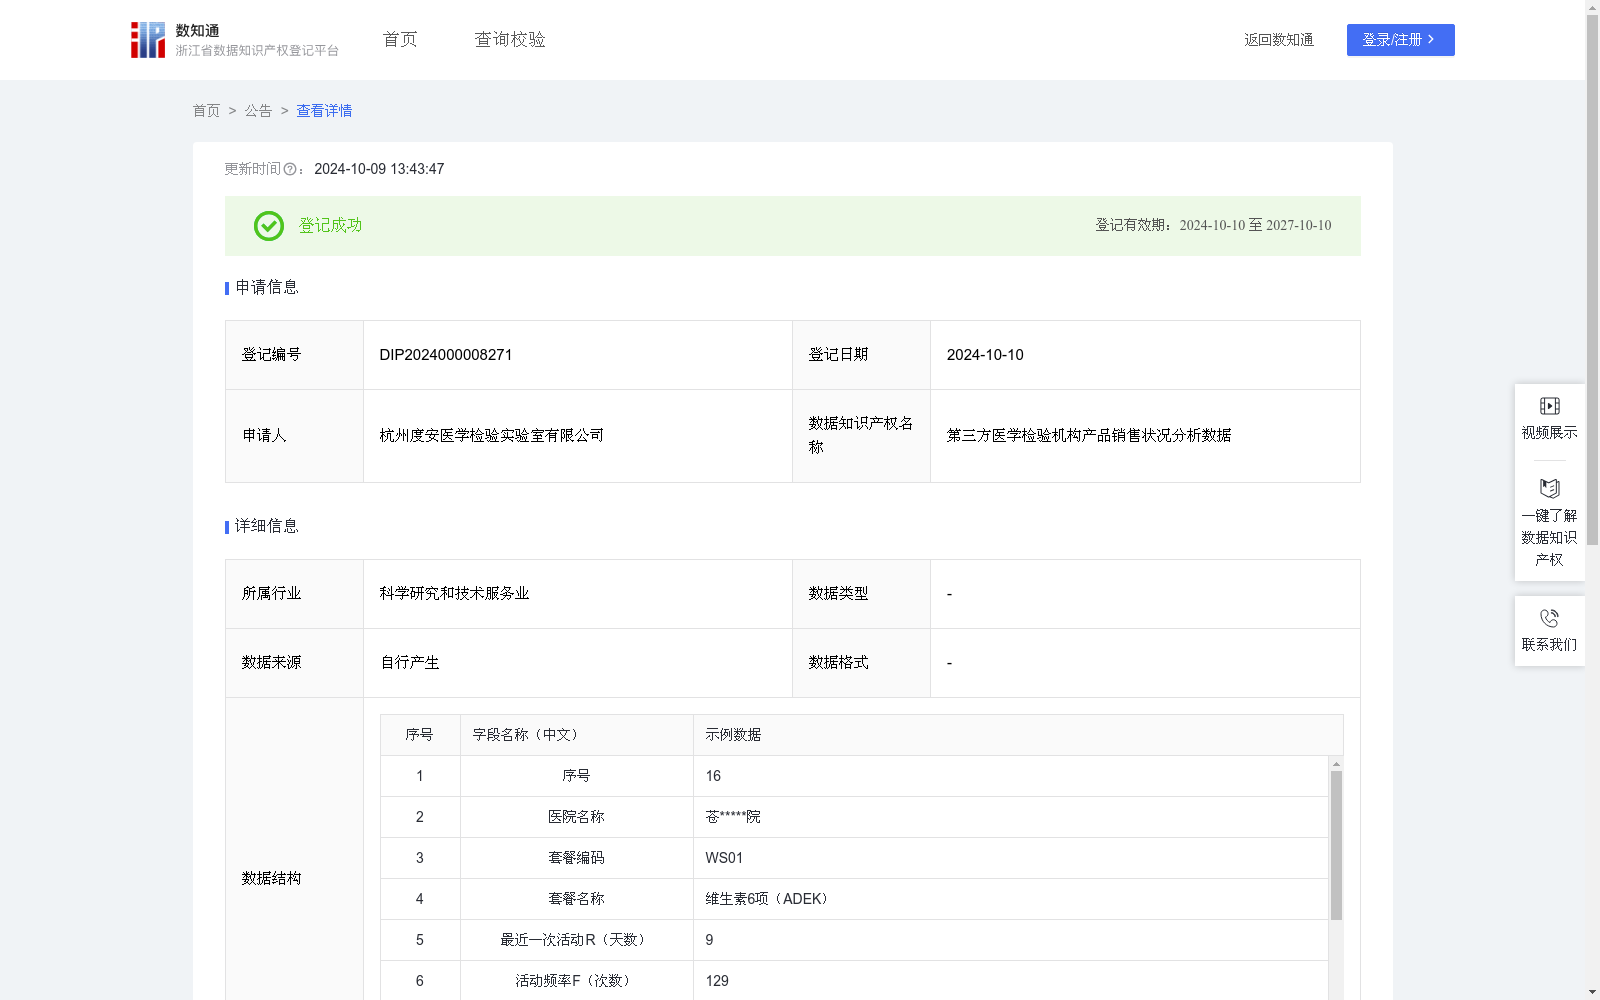
企业在制定某些运营、营销策略时,希望能够针对客户对不同的产品的需求推行不同的策略,实现精准化运营。精准化运营的前提是判断客户对产品的需求,而判断客户对产品的需求的核心是产品价值管理。通过对产品进行分类管理,满足不同客户和当前市场的需求。并为同行业企业提供参考。1、数据处理:对采集到的数据进行脱敏、分析。2、数据加工:运用RFM模型 提取出客户最近一次活动R(天数)、活动频率F(次数)、产品的销售金额M(总额),①所有客户消费总金额=SUM(销售金额M(总额)),所有客户的消费总次数= SUM(活动频率F(次数)),和客户对产品的平均消费金额(客户平均消费金额=所有客户消费总金额/消费总次数),②各个产品的平均消费次数=AVG(活动频率F(次数));③计算所有客户最近一次消费距今平均天数=AVG(最近一次活动R(天数));④通过和平均值比较,向量化三个指标:根据关键指标是否大于客户总体平均值水平进行评价,小于总体平均的设为0,大于总体平均的设为1 ,如:M值评价中,当客户平均单次消费金大于客户平均消费金额时标记为1,否则标记为0,公式为IF(平均单次消费金额>用户平均消费金额,1,0),R值评价、F值评价以此类推;⑤将上述向量化的值拼接起来,公式为CONCATENATE(R值评价,F值评价, M值评价)。⑥分类:111=重要价值产品、011=重要保持产品、101=重要发展产品、001=重要挽留产品、100=一般发展产品和000=一般挽留产品。
When formulating operational and marketing strategies, enterprises aim to implement differentiated strategies tailored to customers' demands for different products to achieve precise operations. The premise of precise operations is to assess customers' demands for products, with the core being product value management. Classified management of products is employed to satisfy the demands of diverse customers and the current market, providing references for peer enterprises.
1. Data Processing: Desensitize and analyze the collected data.
2. Data Enrichment and Feature Calculation: Apply the RFM model to extract three core indicators:
- R (Recency): Number of days since the customer's last activity
- F (Frequency): Number of customer activities
- M (Monetary): Total sales amount of the product
Perform the following calculations and processing steps:
① Calculate total customer consumption amount = SUM of all sales amounts (M), total number of customer activities = SUM of all activity frequencies (F), and average customer consumption amount = Total customer consumption amount / Total number of customer activities.
② Calculate average consumption frequency per product = AVG of activity frequencies (F).
③ Calculate the average number of days since the last customer activity across all customers = AVG of Recency (R) values.
④ Vectorize the three indicators: Evaluate each indicator by comparing it to the overall average value. Assign a value of 0 if the indicator is below the overall average, and 1 if it is above the overall average. For example, for the Monetary (M) evaluation: mark as 1 if the customer's average per-consumption amount exceeds the overall average customer consumption amount, otherwise mark as 0, with the formula: "IF(average per-consumption amount > overall average customer consumption amount, 1, 0)". The same logic applies to the Recency (R) and Frequency (F) evaluations.
⑤ Concatenate the vectorized values using the formula: "CONCATENATE(R evaluation score, F evaluation score, M evaluation score)".
⑥ Classify the products based on the resulting 3-digit binary code:
- 111 = Important Value Products
- 011 = Important Retention Products
- 101 = Important Development Products
- 001 = Important Churn-Risk Products
- 100 = General Development Products
- 000 = General Churn-Risk Products
提供机构:
杭州度安医学检验实验室有限公司
创建时间:
2024-09-10
搜集汇总
数据集介绍
特点
该数据集为第三方医学检验机构产品销售状况分析数据,包含506条记录,每月更新。数据通过RFM模型分析客户行为,支持企业进行产品分类管理和精准化运营策略制定。
以上内容由遇见数据集搜集并总结生成


