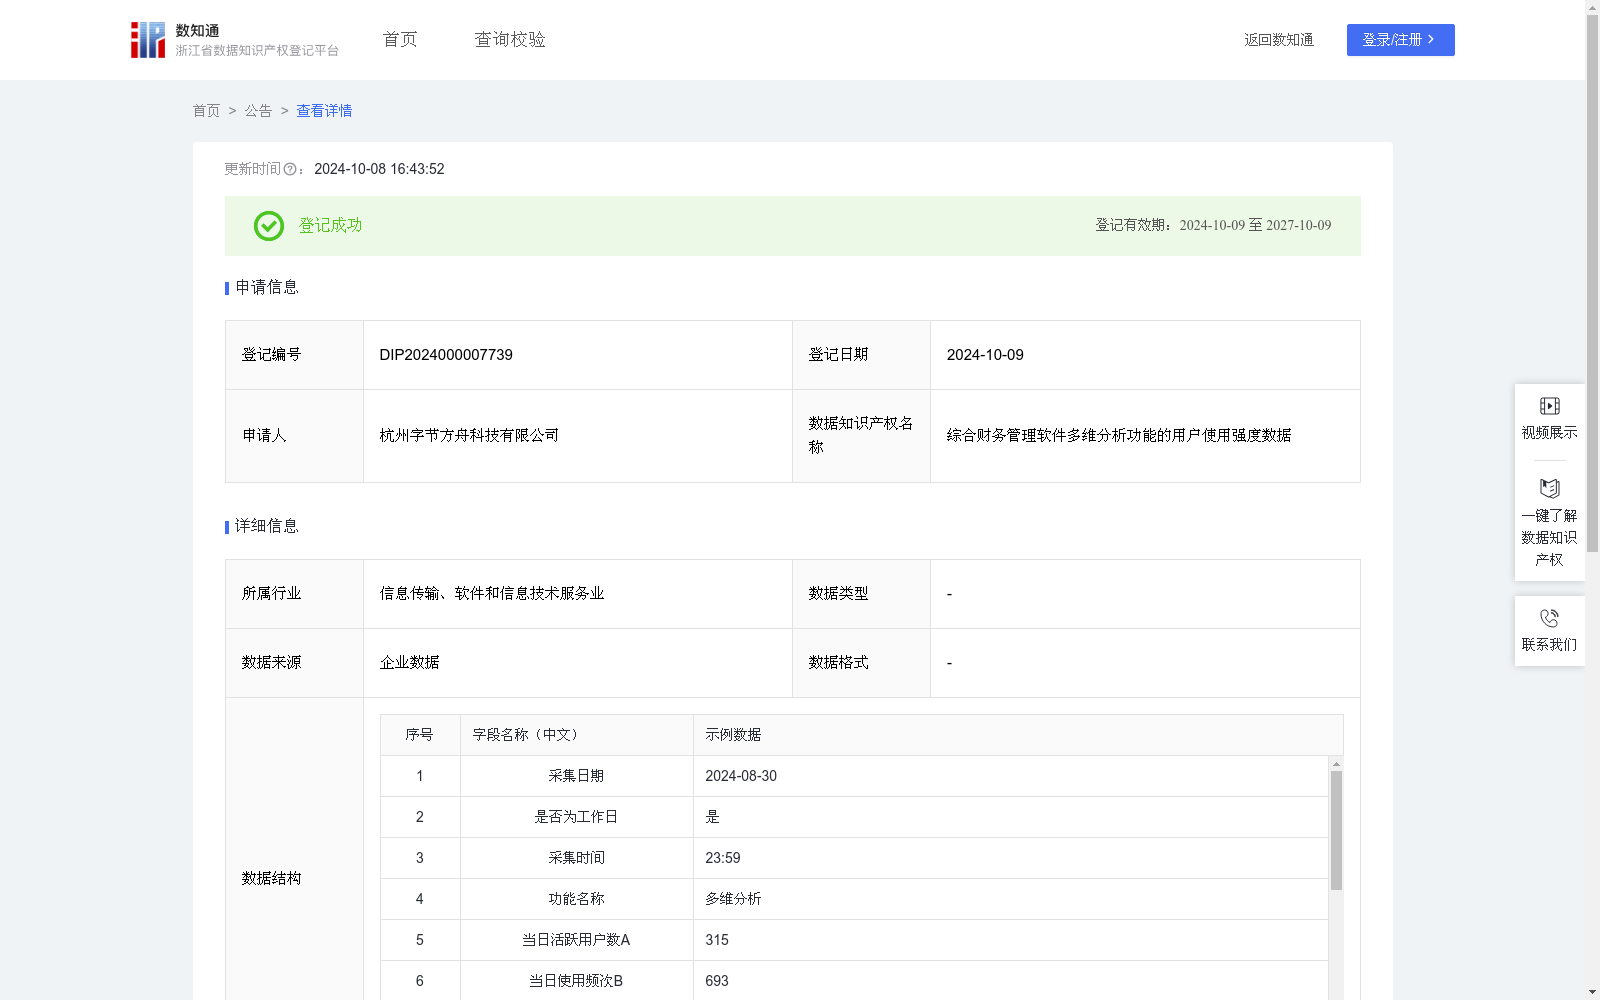
综合财务管理软件多维分析功能的用户使用强度数据
收藏浙江省数据知识产权登记平台2024-10-08 更新2024-10-09 收录
下载链接:
https://www.zjip.org.cn/home/announce/trends/68321
下载链接
链接失效反馈官方服务:
资源简介:
1.对本公司的用途:1)用户使用强度数据是一个创新的量化工具,用于反映用户与综合财务管理软件多维分析功能的交互程度,通过对本数据的长期跟踪,公司既可以评估多维分析功能的设置效果,又可以进一步对功能的未来使用趋势进行预测,为多维分析功能的后续改进提供辅助依据;2)本数据还能帮助公司在资源分配上做出更明智的决策,例如公司可以根据用户使用强度的数值变化决定服务器容量的增减,不仅能够保证服务的稳定性和响应速度,还能降低公司的运营成本。
2.对其他综合财务管理软件(或其他类似软件)开发者(同行)的用途:本数据可以帮助同行客观准确地了解综合财务管理软件中多维分析功能的受欢迎程度、依赖程度和普及度,为同行在类似软件中设置或改进多维分析功能提供决策依据,推动行业发展。1.数据采集和预处理:
(1)从公司自营的综合财务管理软件的用户行为日志中,提取反映用户每天使用“多维分析功能”情况的数据,包括采集日期、是否为工作日、采集时间、功能名称、当日活跃用户数A、当日使用频次B、当日使用总时长C、当日软件总活跃用户数D;(2)对采集的数据进行清洗,去除重复、错误或无关的信息,以便后续的加工和建模。
2.建立多维分析功能的用户使用强度计算模型:
(1)计算功能当日使用率S:S=A÷D×100%;(2)计算当日平均使用时长P:P=C÷A:(3)引入时间加权因子q,以反映工作日和非工作日的差异:如果当天是工作日,则q为1.2,反之则q为0.8;(4)计算当日加权使用频次Bq和当日加权平均使用时长Pq:Bq=B×q,Pq=P×q;(5)计算当日用户活跃度指数H:H=√(A×Bq);(6)基于主成分分析法(PCA)建立用户使用强度W计算模型:W=H×0.5+Pq×0.25+S×0.25;每个指标在主成分中的权重,结合其重要性并结合行业经验确定,H被赋予了稍高的权重,因为它可以更直接地反映用户的参与度和多维分析功能的用户基础。
1. Internal Usage for the Company:
1) User usage intensity data is an innovative quantitative tool for reflecting the degree of user interaction with the multi-dimensional analysis functions of comprehensive financial management software. Through long-term tracking of this data, the company can evaluate the effectiveness of the multi-dimensional analysis function settings, and further predict the future usage trends of the functions, providing auxiliary support for subsequent improvements of the multi-dimensional analysis functions.
2) This data can also help the company make more informed resource allocation decisions. For example, the company can decide whether to increase or decrease server capacity based on changes in user usage intensity values, which not only ensures service stability and response speed, but also reduces the company's operating costs.
2. Usage for Developers (Peers) of Other Comprehensive Financial Management Software (or Similar Software):
This data can help peers objectively and accurately understand the popularity, dependency and penetration rate of multi-dimensional analysis functions in comprehensive financial management software, providing decision-making basis for peers to set up or improve multi-dimensional analysis functions in similar software, and promoting industry development.
1. Data Collection and Preprocessing:
(1) Extract data reflecting users' daily usage of the "multi-dimensional analysis function" from the user behavior logs of the company's self-operated comprehensive financial management software, including collection date, whether it is a working day, collection time, function name, daily active users A, daily usage frequency B, total daily usage duration C, and total daily active users of the software D;
(2) Clean the collected data to remove duplicate, erroneous or irrelevant information for subsequent processing and modeling.
2. Establishment of User Usage Intensity Calculation Model for Multi-dimensional Analysis Functions:
(1) Calculate the daily usage rate S of the function: S = A ÷ D × 100%;
(2) Calculate the daily average usage duration P: P = C ÷ A;
(3) Introduce a time weighting factor q to reflect the difference between working days and non-working days: q is 1.2 if the day is a working day, otherwise q is 0.8;
(4) Calculate the daily weighted usage frequency Bq and daily weighted average usage duration Pq: Bq = B × q, Pq = P × q;
(5) Calculate the daily user activity index H: H = √(A × Bq);
(6) Establish the user usage intensity W calculation model based on Principal Component Analysis (PCA): W = H × 0.5 + Pq × 0.25 + S × 0.25. The weights of each indicator in the principal components are determined by combining their importance and industry experience. H is assigned a slightly higher weight because it can more directly reflect user engagement and the user base of the multi-dimensional analysis functions.
提供机构:
杭州字节方舟科技有限公司
创建时间:
2024-09-03
搜集汇总
数据集介绍
以上内容由遇见数据集搜集并总结生成


