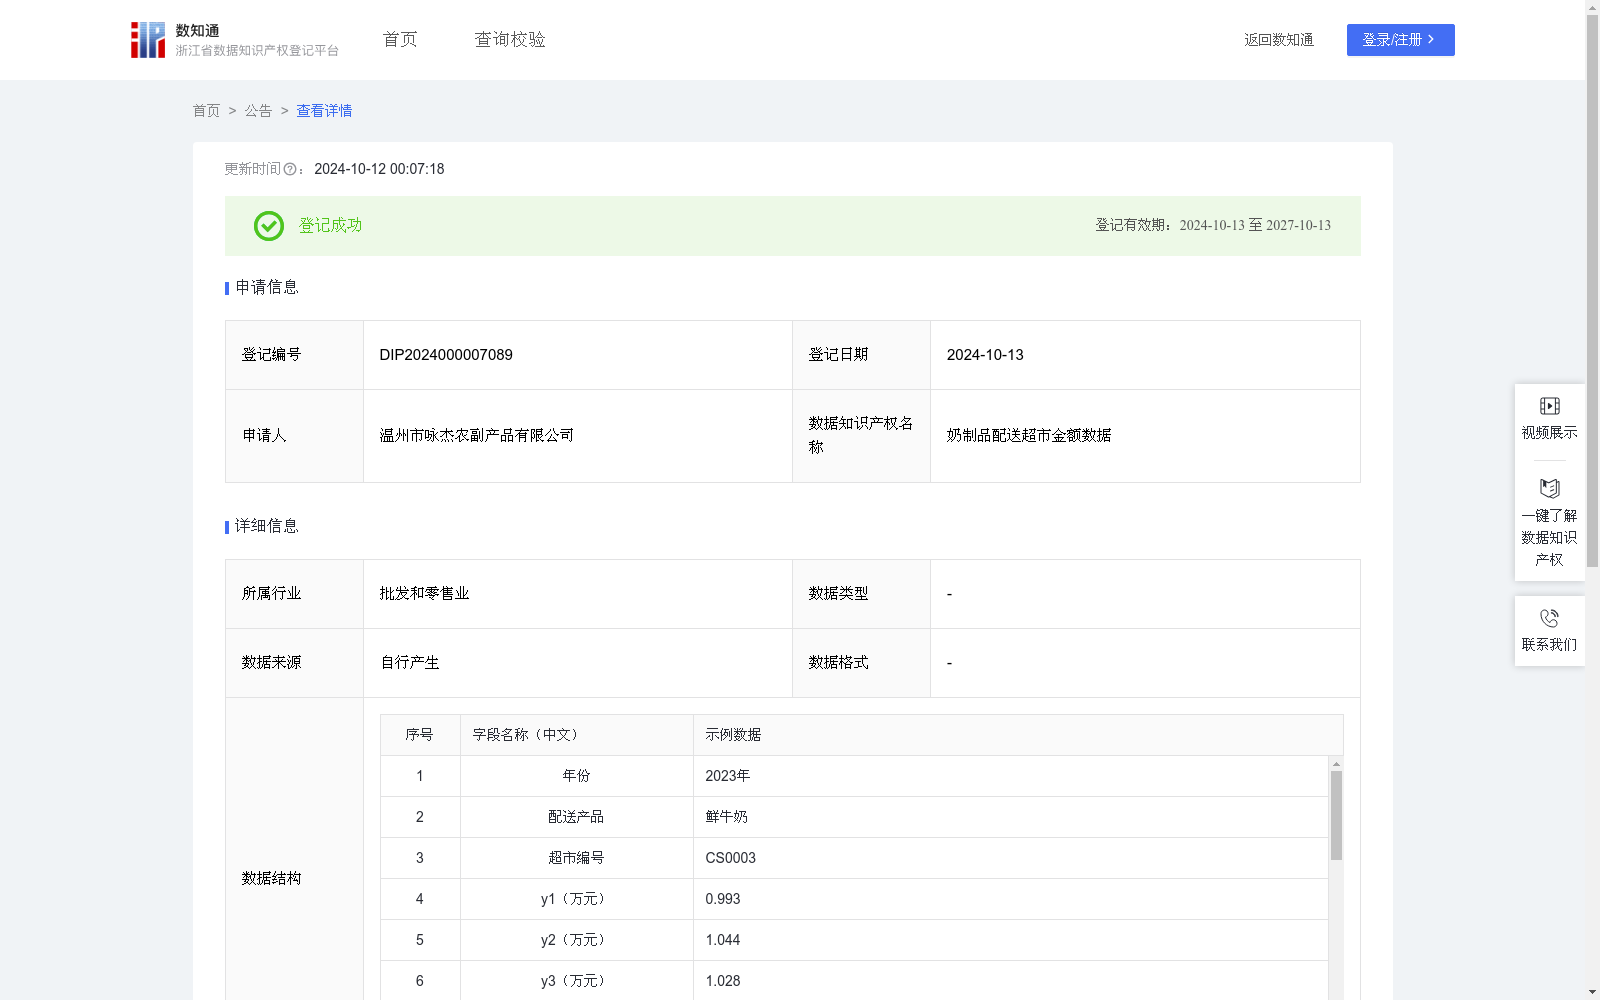
奶制品配送超市金额数据
收藏浙江省数据知识产权登记平台2024-10-12 更新2024-10-14 收录
下载链接:
https://www.zjip.org.cn/home/announce/trends/70175
下载链接
链接失效反馈官方服务:
资源简介:
通过配送管理系统软件采集本公司奶制品配送超市订单信息,将不同的配送订单以各超市来划分,从而计算各个超市每个月的配送金额数据,再计算出12个月的配送金额的方差大小,方差大小用来评价各个超市的配送情况,从而用于评估所有超市的采购和配送策略,所有企业可以通过该数据了解奶制品在不同超市的配送行情,以平衡采购和配送奶制品数量。例如对于超平稳型超市,本行业内企业无需时时关注该超市的行情,可每月保持好奶制品的采购和配送数量;对于一般平稳型超市,本行业内企业需每季度关注该超市的行情,适当调整奶制品的采购和配送数量;而对于波动型超市,本行业内企业需每月时时关注该超市行情,了解该超市的配送行情变化,以适应大幅度调整奶制品的采购和配送数量变化。其次,本数据还能为配送行业的相关企业(如物流公司、农贸市场等)提供整体性参考,从而有效洞察市场趋势,更好地做出科学的营销决策。步骤1:通过配送管理系统软件采集本公司奶制品配送超市的订单信息,将不同的配送订单以各超市来划分归类,从而将各年度每个月配送至超市的金额,从一月至十二月依次用y1,y2...y12表示,并汇总计算得到各个超市当年的总配送金额y。步骤2:计算各超市的月平均配送金额y̅=各个超市当年的总配送金额y/12。步骤3:根据方差公式计算方差s2={(y1-y̅)^2+(y2-y̅)^2+(y3-y̅)^2+…+(y12-y̅)^2}/12,从而得到各个超市的月配送金额的方差s2大小。步骤4:当方差s2小于0.01评价该超市为超平稳型超市。当方差s2大于等于0.01并且小于等于0.03评价该超市为一般平稳型超市。当方差s2大于0.03评价该超市为波动型超市。
This dataset is compiled by collecting order information of dairy product deliveries to the company's partnered supermarkets through Delivery Management System (DMS) software. All delivery orders are categorized by individual supermarkets to calculate the monthly delivery amount for each supermarket. Subsequently, the variance of the 12-month delivery amounts is computed to evaluate the delivery performance of each supermarket, which supports the assessment of procurement and delivery strategies across all supermarkets. This dataset enables enterprises to understand the delivery trends and status of dairy products in different supermarkets, thereby balancing the quantities of dairy products purchased and delivered.
For example, for ultra-stable supermarkets, enterprises in the industry do not need to regularly monitor their delivery trends, and can maintain consistent dairy product procurement and delivery volumes each month. For generally stable supermarkets, enterprises should monitor their trends quarterly and make appropriate adjustments to procurement and delivery quantities. For volatile supermarkets, enterprises need to closely track their delivery trends monthly to grasp changes in their delivery status, so as to make substantial adjustments to dairy product procurement and delivery volumes accordingly.
Furthermore, this dataset can also provide holistic references for relevant enterprises in the distribution industry, such as logistics companies and farmers' markets, helping them gain in-depth insights into market trends and formulate more scientific marketing decisions.
The specific data processing steps are as follows:
Step 1: Collect order information of dairy product deliveries to the company's partnered supermarkets via DMS software, classify all delivery orders by individual supermarkets, denote the monthly delivery amounts to each supermarket from January to December as y₁, y₂, ..., y₁₂ respectively, and calculate the total annual delivery amount y for each supermarket.
Step 2: Calculate the monthly average delivery amount ȳ for each supermarket, where ȳ = total annual delivery amount y / 12.
Step 3: Calculate the variance s² of the monthly delivery amounts for each supermarket using the standard variance formula: s² = [(y₁ - ȳ)² + (y₂ - ȳ)² + (y₃ - ȳ)² + ... + (y₁₂ - ȳ)²] / 12.
Step 4: Classify each supermarket into three categories based on its calculated variance s²:
- Ultra-stable supermarket: s² < 0.01
- Generally stable supermarket: 0.01 ≤ s² ≤ 0.03
- Volatile supermarket: s² > 0.03
提供机构:
温州市咏杰农副产品有限公司
创建时间:
2024-08-29
搜集汇总
数据集介绍
特点
该数据集记录了奶制品配送至各超市的金额数据,包含3168条记录,每年更新一次。数据通过计算各超市的月配送金额及其方差,用于评估超市的配送情况,帮助优化采购和配送策略。
以上内容由遇见数据集搜集并总结生成


