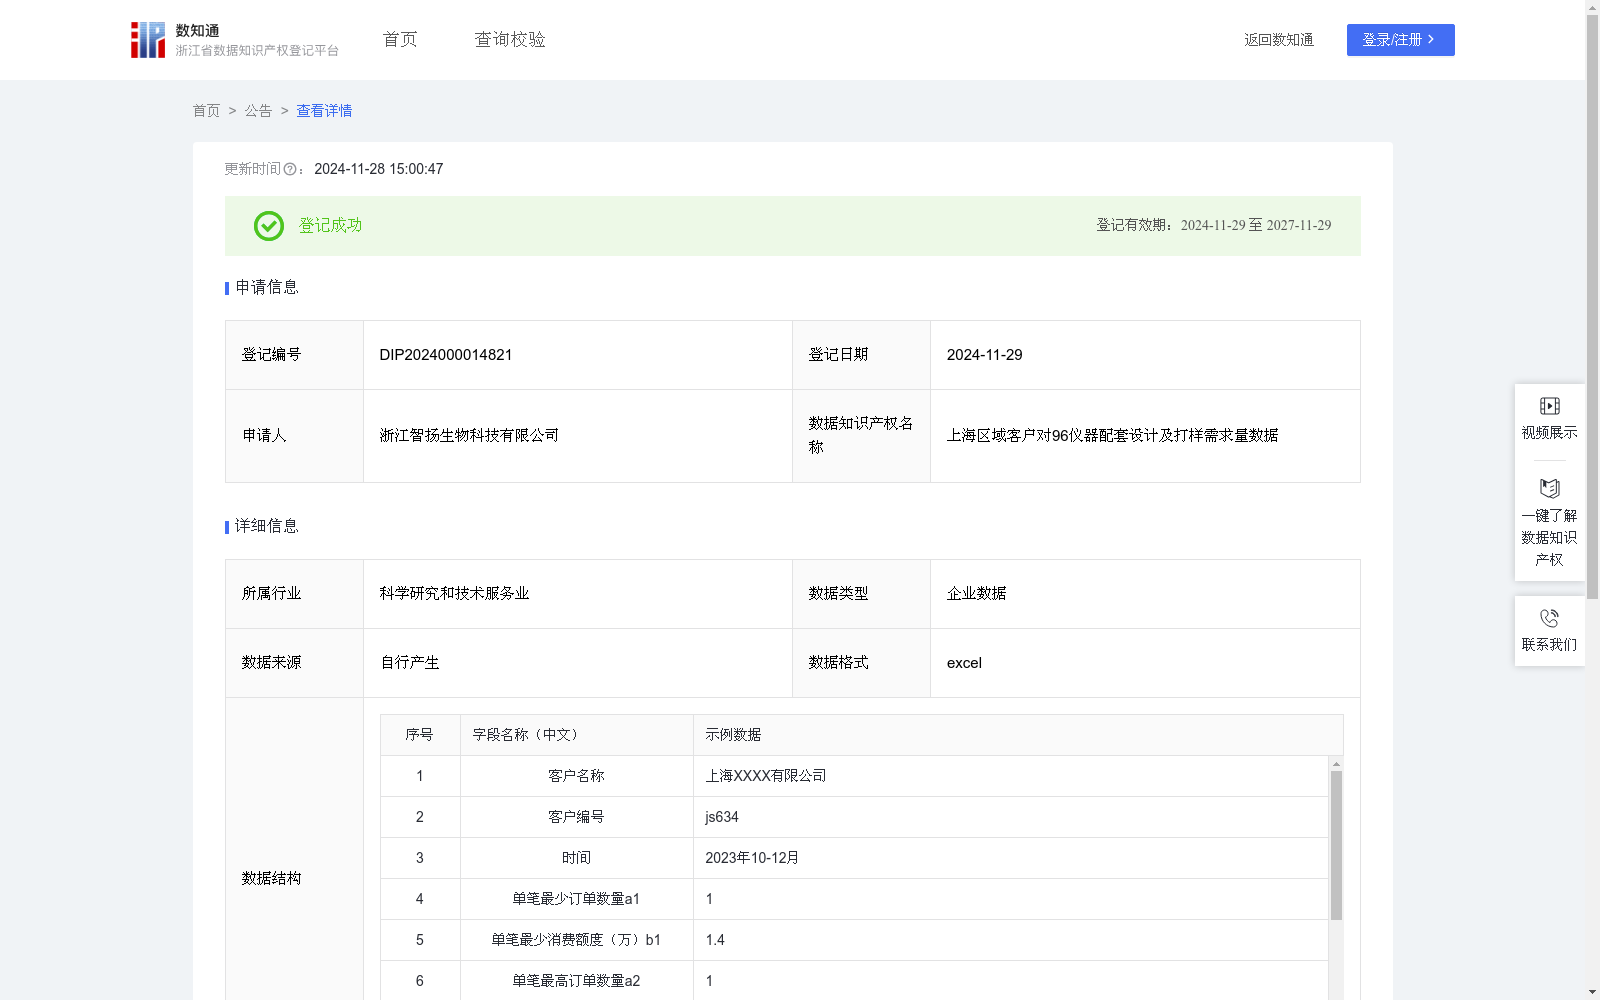
上海区域客户对96仪器配套设计及打样需求量数据
收藏浙江省数据知识产权登记平台2024-11-28 更新2024-11-29 收录
下载链接:
https://www.zjip.org.cn/home/announce/trends/90819
下载链接
链接失效反馈官方服务:
资源简介:
通过收集和分析上海客户对96仪器配套设计及打样相关数据,了解客户对96仪器配套设计及打样的购买力水平和消费偏好,从而了解该产品是否畅销,从而为本行业的所有企业制定生产策略,更好地为用户提供个性化的商品和服务。帮助公司更好地理解客户,高等级企业可每月1至2次与企业沟通,中等级可每季度1至2次与企业沟通,低等级企业可每半年1至2次与企业沟通,从而制定更精准的生产营销策略。1.数据采集:采集平时客户对96仪器配套设计及打样的相关交易数据。2.数据处理:对采集到数据进行分类、合并、累加,便于分析使用。3.算法加工:将处理后的数据进行需求量分析:P={a1(单笔最少订单数量)/b1(单笔最少消费额度)+a2(单笔最高订单数量)/b2(单笔最高消费额度)+a3(平均订单数量)/b3(平均消费额度)}*k,k为消费系数,不同地区系数大小值不同,按经验取值上海k值为0.8。4、数据分类分级:根据计算出的需求量水平,将客户等级划分为“高、中、低”不同的类别和级别(2分以上标记为“高等级”,1-2分区间内标记为“中等级”,1分以下标记为“低等级”)。
By collecting and analyzing data related to supporting design and prototyping services for 96-type instruments from regular Shanghai customers, this dataset aims to investigate customers' purchasing power and consumption preferences for such services, evaluate the market popularity of these services, formulate production strategies for all enterprises in the relevant industry, and provide more personalized products and services to users. It also enables enterprises in the industry to better understand their customers: companies can communicate with high-tier customers 1 to 2 times per month, mid-tier customers 1 to 2 times per quarter, and low-tier customers 1 to 2 times every six months, so as to develop more precise production and marketing strategies. 1. Data Collection: Gather transaction data related to supporting design and prototyping services for 96-type instruments from regular customers. 2. Data Preprocessing: Classify, merge and aggregate the collected data to facilitate subsequent analysis and utilization. 3. Algorithm-based Processing: Conduct demand analysis on the preprocessed data using the formula: P={a1 (minimum single-order quantity)/b1 (minimum single-order consumption amount) + a2 (maximum single-order quantity)/b2 (maximum single-order consumption amount) + a3 (average order quantity)/b3 (average consumption amount)} * k, where k is the consumption coefficient with varying values across different regions. Based on empirical experience, the k value for Shanghai is set to 0.8. 4. Data Classification and Grading: Divide customers into "high-tier", "mid-tier" and "low-tier" categories based on the calculated demand score: customers with a score greater than 2 are marked as "high-tier", those with a score between 1 and 2 (inclusive) are marked as "mid-tier", and those with a score less than 1 are marked as "low-tier".
提供机构:
浙江智扬生物科技有限公司
创建时间:
2024-11-06
搜集汇总
数据集介绍
特点
该数据集包含563条上海区域客户对96仪器配套设计及打样的需求量数据,涵盖客户名称、订单数量、消费额度等信息,用于分析客户购买力和消费偏好,帮助企业制定生产和营销策略。
以上内容由遇见数据集搜集并总结生成


