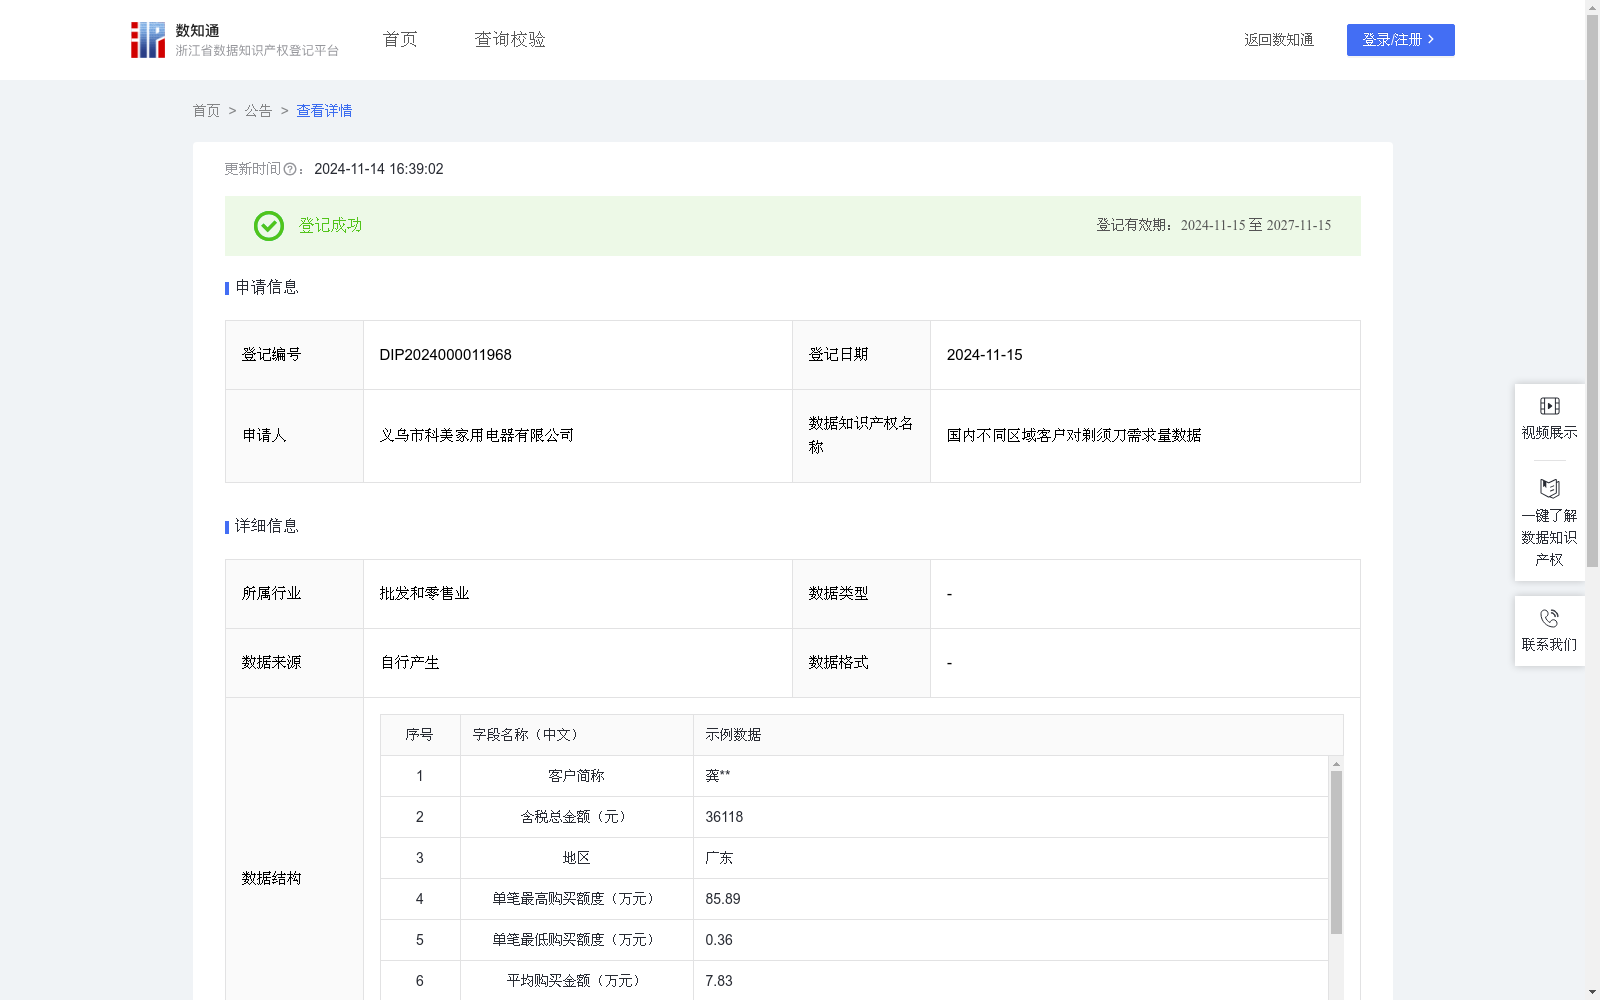
国内不同区域客户对剃须刀需求量数据
收藏浙江省数据知识产权登记平台2024-11-14 更新2024-11-15 收录
下载链接:
https://www.zjip.org.cn/home/announce/trends/84838
下载链接
链接失效反馈官方服务:
资源简介:
通过收集和分析国内客户对剃须刀订单相关数据,了解客户对剃须刀的购买力水平和需求偏好,从而了解剃须刀在各区域是否畅销,从而为本行业的所有企业制定生产策略、营销策略、仓储策略提供数据依据,更好地为用户提供个性化的商品和服1、数据收集:采集剃须刀国内客户订单的时间、产品价格等数据。
2、数据处理:对数据进行清洗,去除无效数据、极限数据。
3、数据加工:用MAX、MIN、IF函数嵌套查出不同省份单笔最高购买额度(万元)Xmax、单笔最低购买额度(万元)Xmin、订单平均购买金额(万元)Xave,计算得到省份订单极差A=Xmax-Xmin,方差B=((Xmax-Xave)^2+(Xmin-Xave)^2)/2,需求量C=(Xmax+Xmin+Xave)/3*k,k为区域系数,不同区域k值不同(如广东省k取1.5),C在(∞,80]之间该省份评为高需求,C在(80,30]之间该省份评为中需求,C在(30,0]之间该省份评为低需求。
4、数据应用:区域需求评级帮助公司更合理的利用资源,在高需求区域建立多个仓库存放畅销产品,低需求区域少建立仓库避免滞销。极差和方差帮助公司了解区域交易的波动幅度,方差越大数据的波动越大;方差越小数据的波动越小,极差反映数据的波动范围。
This dataset is constructed by collecting and analyzing domestic customer order data related to shavers, aiming to understand customers' purchasing power and demand preferences for shavers, as well as the regional sales performance of shavers. The dataset provides data-driven evidence for all enterprises in the industry to formulate production, marketing and warehousing strategies, and to deliver personalized products and services to end-users more effectively.
1. Data Collection: Collect data including order time and product price from domestic customers' shaver orders.
2. Data Preprocessing: Clean the dataset to remove invalid and outlier data.
3. Data Processing & Calculation: Using nested MAX, MIN and IF functions, calculate the maximum single-order purchase amount (X_max, in ten thousand yuan), minimum single-order purchase amount (X_min, in ten thousand yuan) and average order purchase amount (X_ave, in ten thousand yuan) for each province. Then compute the following indicators for each province:
- Order range A = X_max - X_min
- Variance B = [(X_max - X_ave)² + (X_min - X_ave)²]/2
- Demand level C = [(X_max + X_min + X_ave)/3] * k, where k is the regional coefficient with different values for different regions (e.g., k=1.5 for Guangdong Province).
Provinces are classified into three demand tiers: high demand for C within (-∞, 80], medium demand for C within (80, 30], and low demand for C within (30, 0].
4. Data Application: The regional demand rating helps enterprises allocate resources more rationally: establish multiple warehouses in high-demand regions to stock best-selling products, and build fewer warehouses in low-demand regions to avoid product stagnation. The order range and variance enable enterprises to understand the fluctuation magnitude of regional transactions: a larger variance indicates greater data volatility, while a smaller variance indicates lower volatility; the order range reflects the fluctuation range of the transaction data.
提供机构:
义乌市科美家用电器有限公司
创建时间:
2024-10-18
搜集汇总
数据集介绍
以上内容由遇见数据集搜集并总结生成


