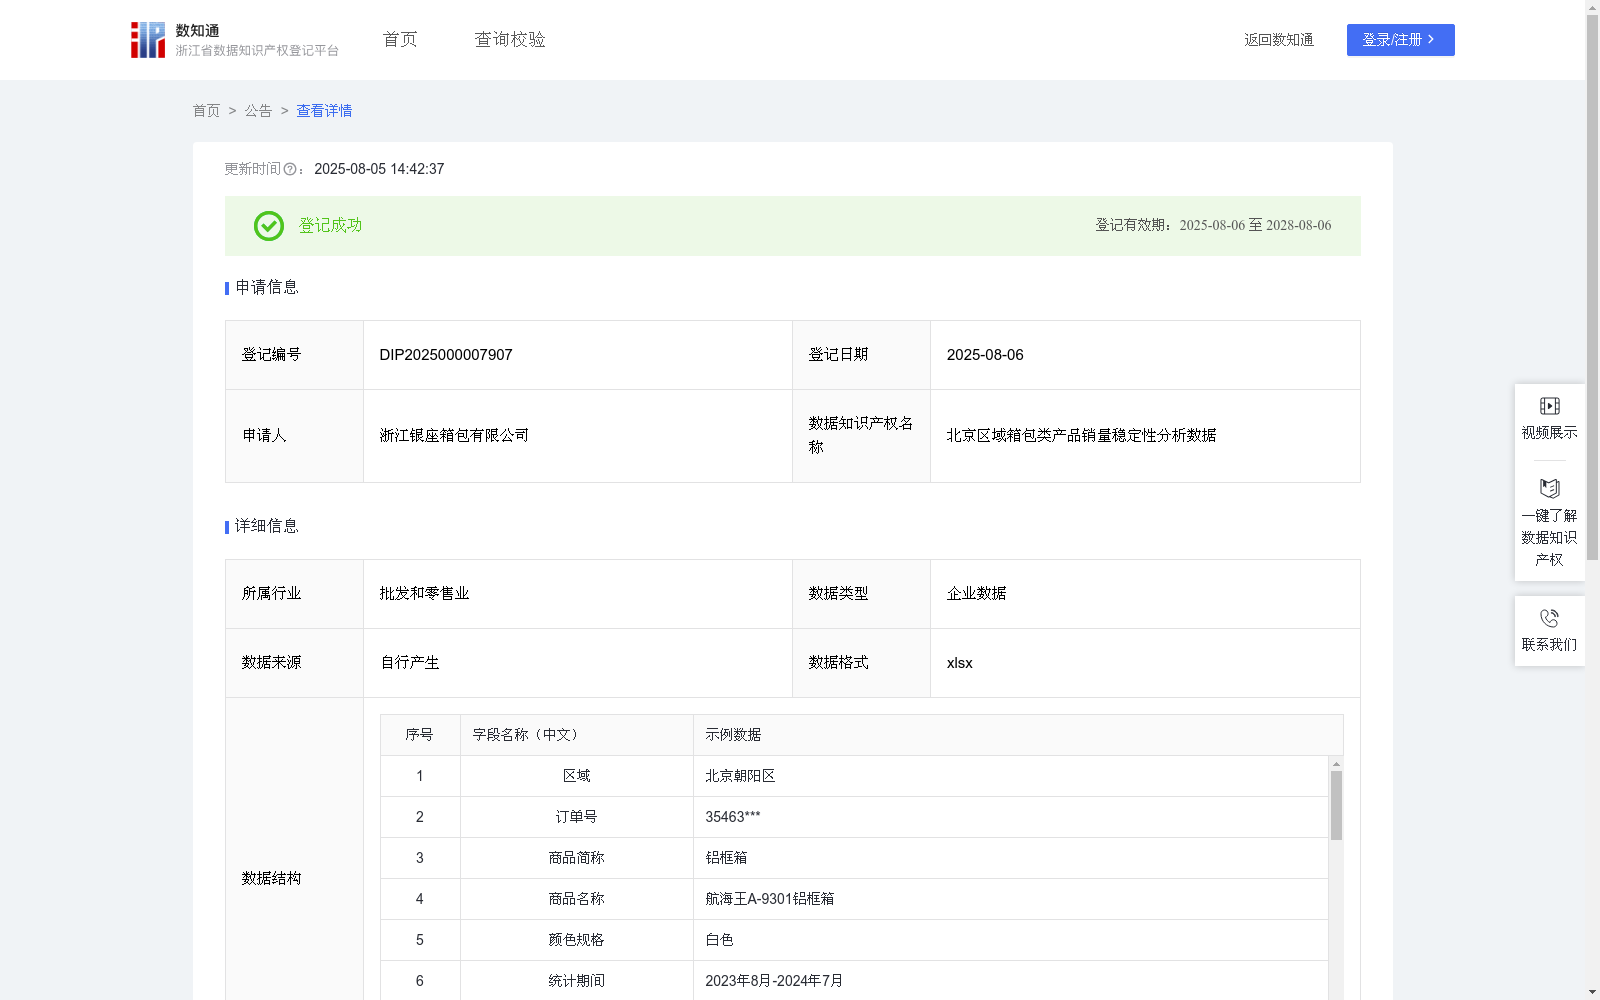
北京区域箱包类产品销量稳定性分析数据
收藏浙江省数据知识产权登记平台2025-08-05 更新2025-08-06 收录
下载链接:
https://www.zjip.org.cn/home/announce/trends/159148
下载链接
链接失效反馈官方服务:
资源简介:
北京区域箱包类产品销量稳定性分析数据,能有效指导企业优化区域市场策略。通过分析不同品类的箱包在各区域的销量波动特征,企业可借鉴高稳定性商品的成功经验,制定更具针对性的营销方案。该数据不仅能为投资者评估行业长期价值提供参考,还能通过竞品对比揭示自身优劣势,辅助制定差异化竞争策略。更重要的是,这套分析方法同样适用于鞋帽、服饰等具有季节性、潮流敏感度高的消费品行业,帮助其把握区域市场特征,优化产品布局。最终,这种稳定性分析将转化为企业精准配置资源、提升市场竞争力的重要决策依据。
1.数据收集和预处理:(1)数据收集:收集商品销量数据,具体包括区域、订单号、商品简称、商品名称、颜色规格、统计期间、付款时间、销量,其中销量计量单位是个。(2)数据预处理:对采集到的原始数据进行处理,去除缺失和异常数据。 2.数据计算汇总:将该商品的月销量,从2023月8月-2024月7月依次用X1,X2,X3...X10,X11,X12表示,并汇总计算得到总销量A。 3.建立销量稳定性分析模型:(1)计算月平均销量B(取整数):月平均销量B=A/12;(2)计算月平均销量方差S²(取整数):月平均销量方差S²=[(X1-B)^2+(X2-B)^2+(X3-B)^2+…+(X12-B)^2]/12;(3)计算标准差S(取整数):S=√S²;(4)计算变异系数CV(保留2位小数):CV=S/B;(5)销量稳定性分析:当:CV小于0.3,则分析结论为“销量很平稳”;当CV大于等于0.3且小于0.6,则分析结论为“销量一般稳定”,当CV大于等于0.6,则分析结论为”销量波动大”。(数据所涉及销量的计量单位均为个)
Sales stability analysis data for luggage products in the Beijing region, which effectively guides enterprises to optimize their regional market strategies. By analyzing the sales fluctuation characteristics of different luggage categories across various regions, enterprises can draw lessons from the successful experience of highly stable products and develop more targeted marketing plans. This data can not only provide reference for investors to evaluate the long-term value of the industry, but also reveal their own advantages and disadvantages through competitor comparison, and assist in formulating differentiated competition strategies. More importantly, this analysis method is also applicable to consumer goods industries with high seasonality and fashion sensitivity such as shoes, hats and apparel, helping them grasp regional market characteristics and optimize product layout. Ultimately, this stability analysis will be transformed into an important decision-making basis for enterprises to accurately allocate resources and enhance market competitiveness.
1. Data Collection and Preprocessing:
(1) Data Collection: Collect product sales data, specifically including region, order number, product abbreviation, product name, color specification, statistical period, payment time, and sales volume, where the unit of sales volume is "piece".
(2) Data Preprocessing: Process the collected raw data by removing missing and abnormal data.
2. Data Calculation and Summary: The monthly sales of the product from August 2023 to July 2024 are sequentially denoted as X1, X2, X3...X10, X11, X12, and the total sales A is obtained through summary calculation.
3. Establishment of Sales Stability Analysis Model:
(1) Calculate the monthly average sales B (rounded to integer): Monthly average sales B = A / 12;
(2) Calculate the monthly average sales variance S² (rounded to integer): Monthly average sales variance S² = [(X1-B)² + (X2-B)² + (X3-B)² + … + (X12-B)²] / 12;
(3) Calculate the standard deviation S (rounded to integer): S = √S²;
(4) Calculate the coefficient of variation CV (retained to 2 decimal places): CV = S / B;
(5) Sales Stability Analysis: When CV < 0.3, the analysis conclusion is "Very stable sales"; when 0.3 ≤ CV < 0.6, the analysis conclusion is "Generally stable sales"; when CV ≥ 0.6, the analysis conclusion is "Large sales fluctuation". (The unit of sales volume involved in the data is all "piece".)
提供机构:
浙江银座箱包有限公司
创建时间:
2025-06-17
搜集汇总
数据集介绍
以上内容由遇见数据集搜集并总结生成


