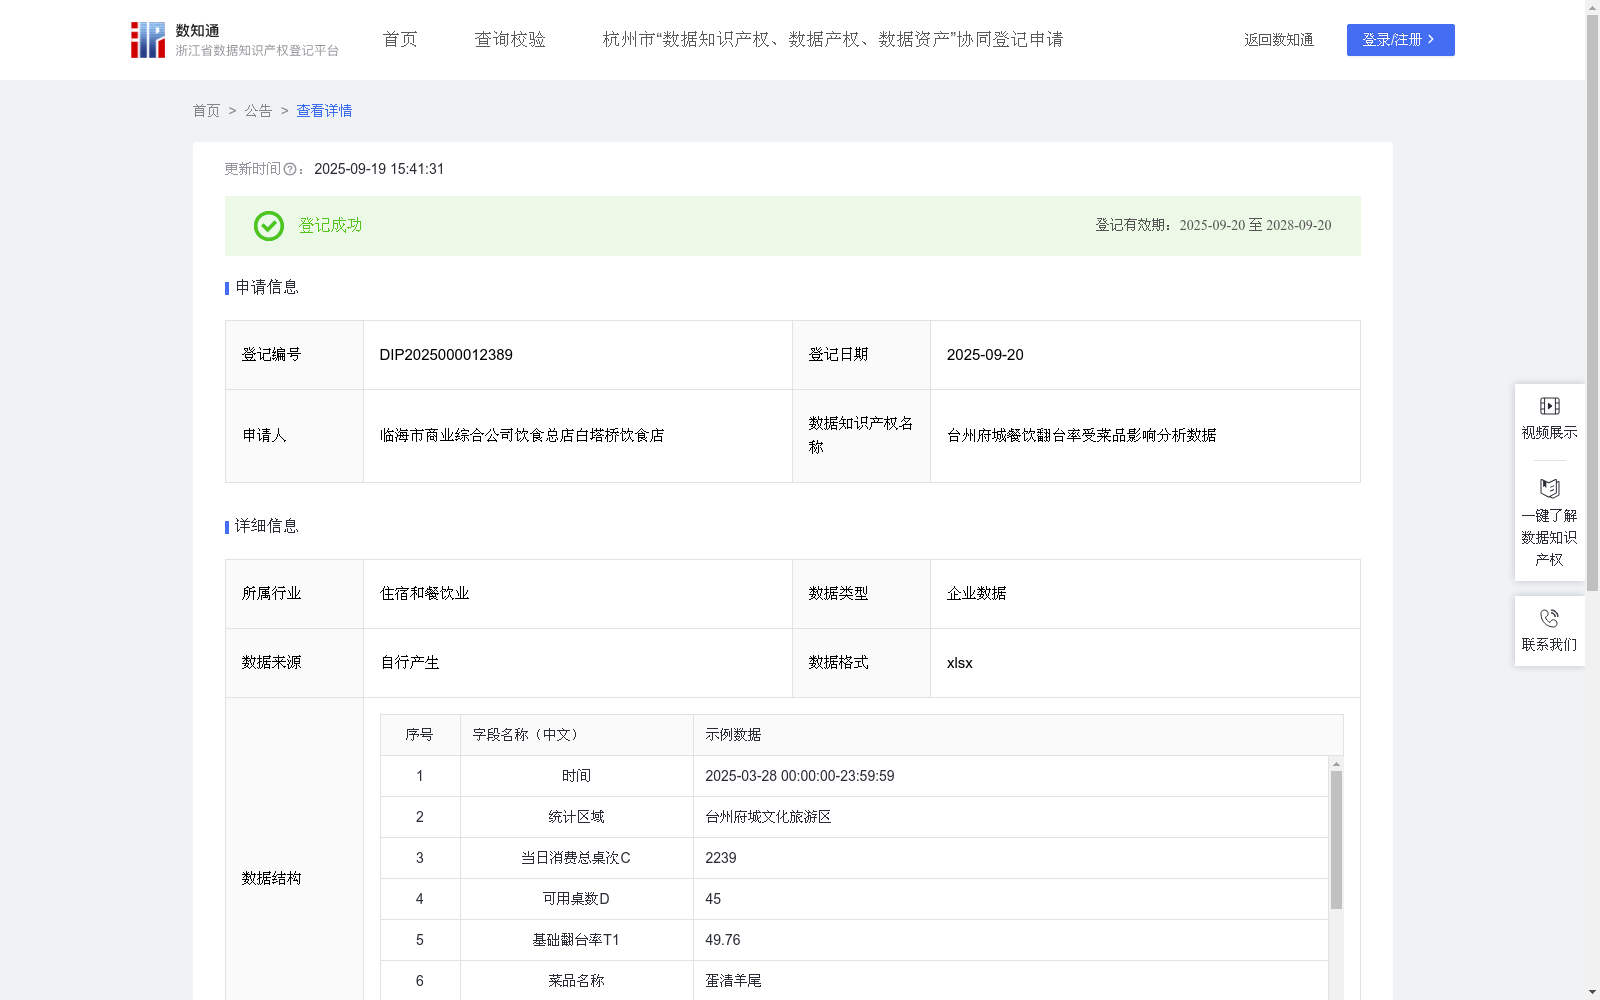
台州府城餐饮翻台率受菜品影响分析数据
收藏浙江省数据知识产权登记平台2025-09-19 更新2025-09-20 收录
下载链接:
https://www.zjip.org.cn/home/announce/trends/183135
下载链接
链接失效反馈官方服务:
资源简介:
本项数据分析面向台州府城文化旅游区的餐饮经营管理场景,通过分析菜品销售数据与运营效率指标的关联关系,量化不同热销菜品对餐厅月平均翻台率的影响程度。本项数据分析可应用于多种功能,如菜单优化决策:识别对翻台率有正向促进作用的菜品,调整菜单结构;供应链管理:根据菜品贡献度优化食材采购比例;营销策略制定:重点推广能提升运营效率的菜品组合。本项数据分析旨在提升旅游景区的餐饮数字化经营管理能力,以便应对当下文旅产业快速发展带来的大量消费人群,目前已在台州府城文化旅游区取得较好的效果,相关分析方法对全国文旅景区的餐饮业均有重要的借鉴推广价值。1.数据输入:菜品维度要素:菜品名称、菜品当日销量V1、菜品一年内的平均销量V2;运营维度要素:统计区域、当日消费总桌次C、可用桌数D。
2.数据运算:基础翻台率T1=C/D; 菜品权重K=(出餐速度系数α×0.3)+(点单频率系数β×0.4)+(就餐时长系数γ×0.3),其中系数α(出餐速度系数)、β(点单频率系数)、γ(就餐时长系数)均为当日数据与一年内平均数据的比值,由系统自动运算生成; 调整后翻台率T2=T1×Σ〔(V1×K)/V2〕。
3.数据分析:将基础翻台率T1与调整后翻台率T2进行比较,若T1≥T2,则说明该菜品对景区的餐饮翻台率并未带来正增长;若T1<T2,则说明该菜品对景区的餐饮翻台率带来正增长,若仅考虑餐饮翻台率的提高,则应增加该菜品的供应量和营销力度。
This data analysis targets the catering operation and management scenario of Taizhou Ancient City Cultural and Tourism Zone, by analyzing the correlation between dish sales data and operational efficiency indicators to quantify the impact degree of different best-selling dishes on the monthly average table turnover rate of restaurants. This data analysis can be applied to multiple functions, such as menu optimization decision-making: identifying dishes that positively promote table turnover rate and adjusting menu structure; supply chain management: optimizing the proportion of ingredient procurement according to dish contribution; marketing strategy formulation: focusing on promoting dish combinations that improve operational efficiency. This data analysis aims to improve the digital operation and management capabilities of catering services in tourist attractions, so as to cope with the large number of consumers brought by the rapid development of the current cultural and tourism industry. It has achieved good results in Taizhou Ancient City Cultural and Tourism Zone, and the relevant analysis methods have important reference and promotion value for the catering industry of cultural and tourism scenic spots across the country. 1. Data Input: Dish dimension elements: dish name, daily sales volume V1 of the dish, annual average sales volume V2 of the dish; Operational dimension elements: statistical area, total daily dining tables C, available tables D. 2. Data Calculation: Basic table turnover rate T1 = C/D; Dish weight K = (order preparation speed coefficient α × 0.3) + (order frequency coefficient β × 0.4) + (dining duration coefficient γ × 0.3), where coefficients α (order preparation speed coefficient), β (order frequency coefficient), γ (dining duration coefficient) are all the ratio of daily data to annual average data, automatically generated by the system; Adjusted table turnover rate T2 = T1 × Σ[(V1×K)/V2]. 3. Data Analysis: Compare the basic table turnover rate T1 with the adjusted table turnover rate T2. If T1 ≥ T2, it means that the dish does not bring positive growth to the catering table turnover rate of the scenic spot; If T1 < T2, it means that the dish brings positive growth to the catering table turnover rate of the scenic spot. If only the improvement of catering table turnover rate is considered, the supply and marketing efforts of this dish should be increased.
提供机构:
临海市商业综合公司饮食总店白塔桥饮食店
创建时间:
2025-07-25
搜集汇总
数据集介绍
背景与挑战
背景概述
该数据集聚焦台州府城文化旅游区餐饮运营,包含1000条记录,通过菜品销量、出餐速度等系数分析对翻台率的影响,用于菜单优化和供应链管理,旨在提升景区餐饮数字化经营效率。
以上内容由遇见数据集搜集并总结生成


