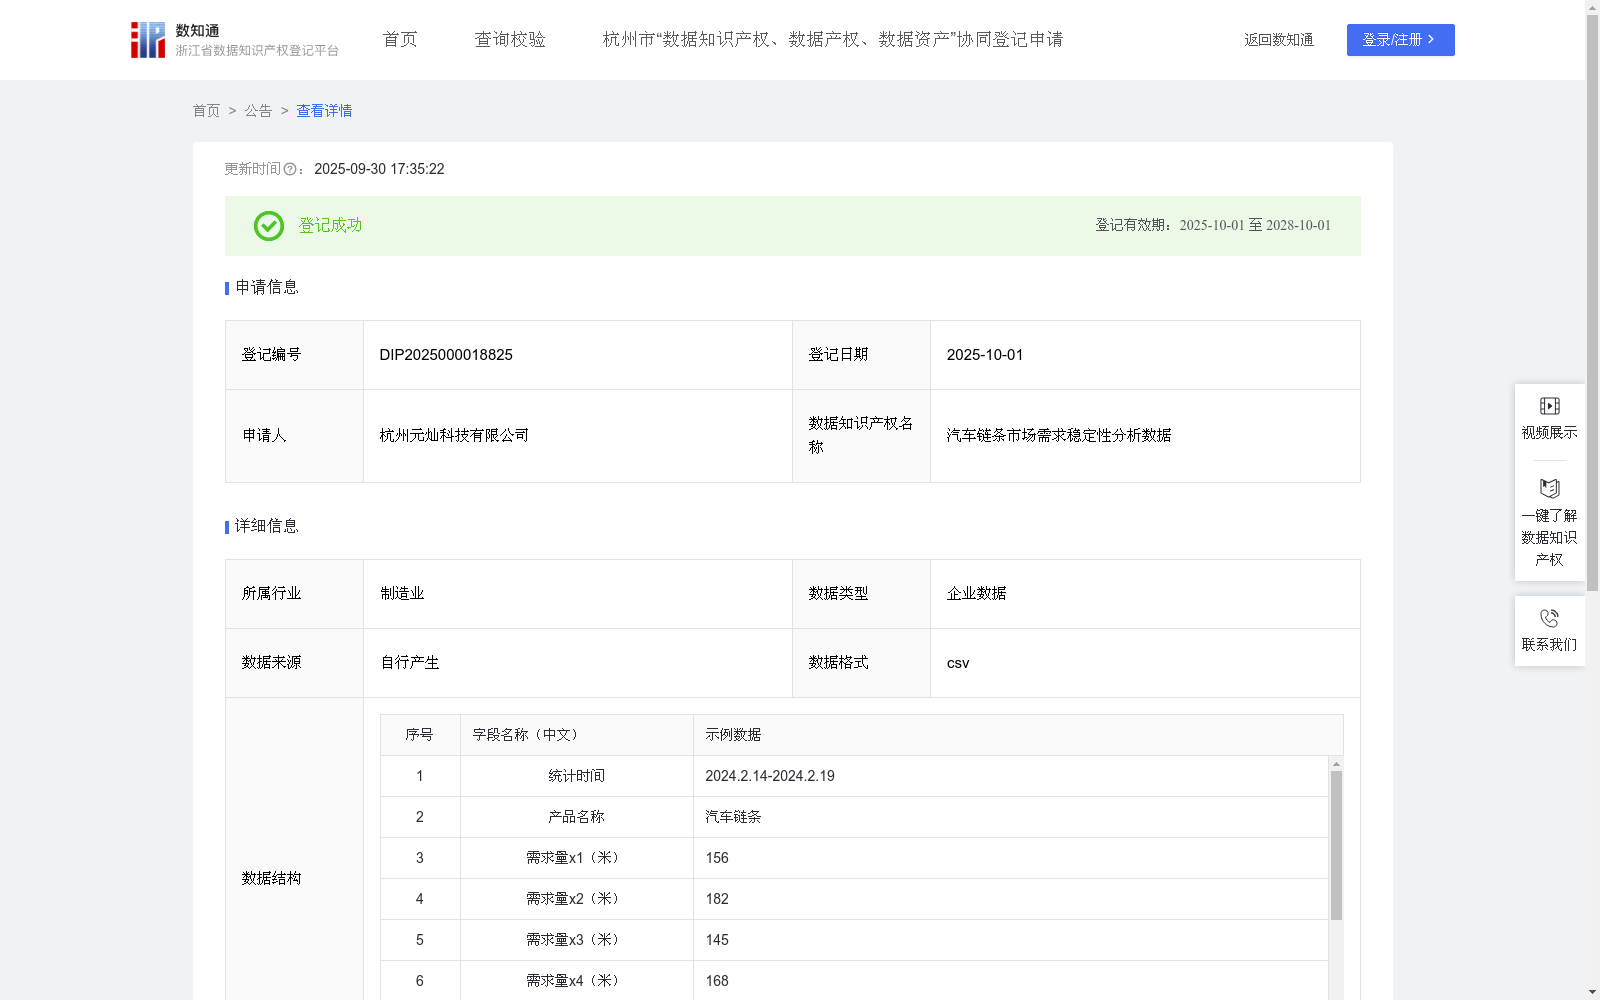
汽车链条市场需求稳定性分析数据
收藏浙江省数据知识产权登记平台2025-09-30 更新2025-10-04 收录
下载链接:
https://www.zjip.org.cn/home/announce/trends/188353
下载链接
链接失效反馈官方服务:
资源简介:
通过分析汽车链条产品的需求稳定性,公司可以明确该产品在市场中的定位,了解其长期需求趋势。同时,对于经销商和零售商而言,了解需求稳定性有助于制定合理的销售策略;对供应商而言,可以根据需求稳定性调整生产和供应策略。1.数据采集:收集公司连续6个自然日汽车链条的需求统计信息,具体包括:统计时间、产品名称、连续6个自然日需求量x1,x2,..,x6。
2.数据汇总:计算该6个自然日总需求量,总需求量等于这6个自然日各自需求数量之和。
3.建立需求稳定性分析模型:(1)计算日平均需求量:日平均需求量=连续6个自然日总需求量/6;(2)计算日需求量方差:设6个自然日的需求量分别为x1,x2,..,x6,日需求量方差=[(x1−日平均需求量)^2+(x2−日平均需求量)^2+...+(x6−日平均需求量)^2]/6。
4.需求稳定性分析:若日需求量方差 < 200,则分析结论为"需求非常稳定";若200≤日需求量方差≤500,则分析结论为"需求一般稳定";若日需求量方差 > 500,则分析结论为"需求波动较大"。
By analyzing the demand stability of automotive chain products, enterprises can clarify the market positioning of this product and grasp its long-term demand trends. Meanwhile, for distributors and retailers, understanding demand stability helps formulate appropriate sales strategies; for suppliers, they can adjust production and supply strategies based on demand stability.
1. Data Collection: Collect the demand statistics of automotive chains over 6 consecutive calendar days, which specifically include: statistical timestamp, product name, and the daily demand volumes x1, x2, ..., x6 across the 6 consecutive calendar days.
2. Data Aggregation: Calculate the total demand over the 6 calendar days, which equals the sum of the daily demand quantities of each day in the 6-day period.
3. Establishment of Demand Stability Analysis Model: (1) Calculate the average daily demand: Average Daily Demand = Total Demand over 6 Consecutive Calendar Days / 6; (2) Calculate the daily demand variance: Let the daily demand quantities of the 6 calendar days be x1, x2, ..., x6, then Daily Demand Variance = [(x1−Average Daily Demand)^2 + (x2−Average Daily Demand)^2 + ... + (x6−Average Daily Demand)^2] / 6.
4. Demand Stability Analysis: If the daily demand variance < 200, the analysis conclusion is "Demand is Very Stable"; if 200 ≤ daily demand variance ≤ 500, the analysis conclusion is "Demand is Generally Stable"; if the daily demand variance > 500, the analysis conclusion is "Demand Fluctuates Significantly".
提供机构:
杭州元灿科技有限公司
创建时间:
2025-09-02
搜集汇总
数据集介绍
背景与挑战
背景概述
该数据集聚焦汽车链条产品的市场需求分析,通过连续6日需求量数据计算方差来评估稳定性,包含550条每日更新的记录。数据集采用明确的三级稳定性判定标准(方差<200/200-500/>500),可直接应用于企业生产规划、经销商策略制定等供应链管理场景。
以上内容由遇见数据集搜集并总结生成


