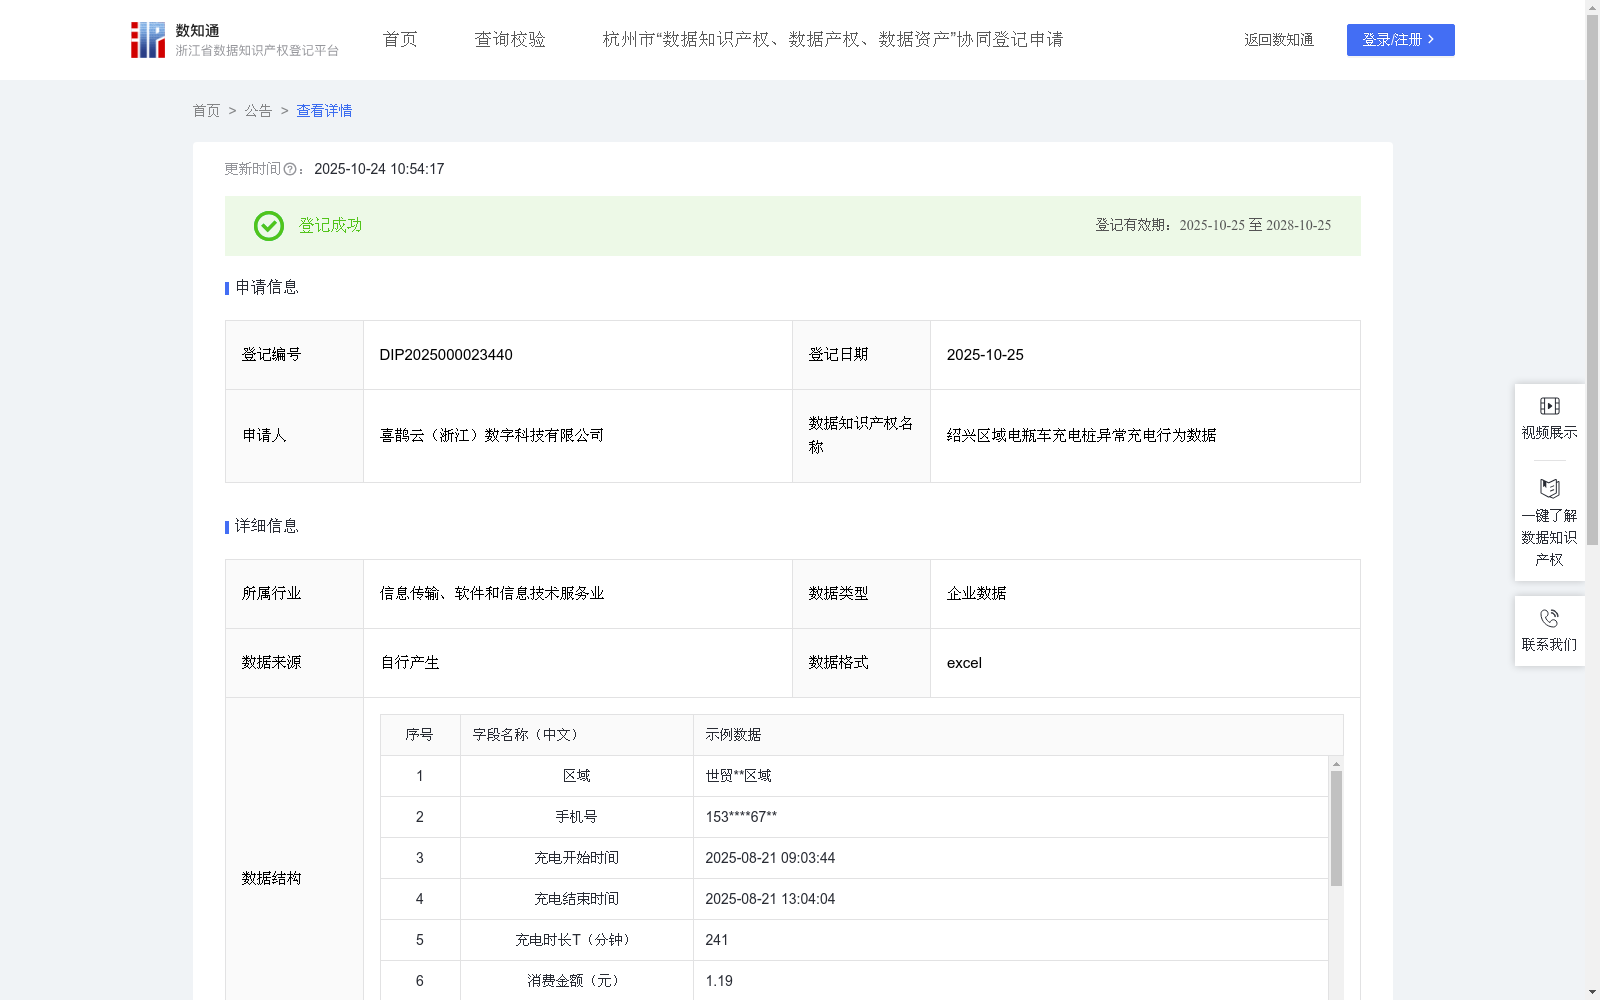
绍兴区域电瓶车充电桩异常充电行为数据
收藏浙江省数据知识产权登记平台2025-10-24 更新2025-10-25 收录
下载链接:
https://www.zjip.org.cn/home/announce/trends/5051466
下载链接
链接失效反馈官方服务:
资源简介:
通过收集和分析电瓶车充电桩的充电行为数据,可以实时监测异常充电事件,如用户超时占用充电桩、低电量长时间充电或重复充电等情况。该数据可供物业管理部门优化充电桩调度策略,减少空置和占用,提高充电桩使用率。同时,为第三方运营平台提供参考数据,用于异常行为预警、合理分配充电资源,以及针对高风险用户推送提醒或限制措施。此外,该数据可用于电力公司分析局部负荷情况,提前缓解电网压力,实现安全和高效的充电管理。1.数据采集:采集充电桩实时充电记录,包括用户手机号、充电开始和结束时间、充电电量及消费金额。
2.数据处理:计算充电时长T(充电结束时间减充电开始时间),判定是否超过最大允许充电时长T_max,标记超时占用o;对充电量低于阈值的记录标记l,对短时间内重复充电记录标记r;统计用户历史异常次数a。
3.算法加工:构建异常综合指数P用于量化异常行为:
P = (0.35 × T(充电时长) + 0.25 × o(超时占用标记)×100 + 0.15 × l(低电量充电标记)×100 + 0.15 × r(重复充电标记)×100 + 0.10 × a(历史异常次数)×10) × s(系统系数)。
公式说明:
T越长,异常可能性越高;
超时占用o=1时显著提高异常权重;
低电量充电l=1时表示不合理占用,提高警示等级;
重复充电r=1表示频繁占用,增加异常指数;
历史异常次数a多,说明用户行为风险高,综合指数随之提高;
系统系数s用于根据整体运营策略进行综合调整。
4.数据分类分级:根据P值将异常行为划分等级:
P ≥ 100 高风险异常,立即通知管理方采取措施;
50 ≤ P < 100 中风险异常,生成运营报告供调度参考;
P < 50 低风险异常,仅用于日常统计分析。
By collecting and analyzing charging behavior data from electric bicycle charging piles, abnormal charging incidents can be monitored in real time, including users occupying the piles beyond the allowed time, charging for a long period with low battery, or repeated charging. This data can be used by property management departments to optimize charging pile scheduling strategies, reduce idle and occupied time, and improve the utilization rate of charging piles. Meanwhile, it provides reference data for third-party operation platforms for abnormal behavior early warning, rational allocation of charging resources, and sending reminders or imposing restriction measures for high-risk users. In addition, this data can be used by power companies to analyze local load conditions, alleviate grid pressure in advance, and achieve safe and efficient charging management.
1. Data Collection: Collect real-time charging records of charging piles, including user phone numbers, charging start and end times, charging electricity consumption and consumption amount.
2. Data Processing: Calculate the charging duration T (charging end time minus charging start time), determine whether it exceeds the maximum allowed charging duration T_max, and mark the over-occupation o; mark records with charging amount lower than the threshold as l, and mark records of repeated charging within a short period as r; count the number of historical abnormal times a of the user.
3. Algorithm Processing: Construct a comprehensive abnormal index P to quantify abnormal behaviors:
P = (0.35 × T (charging duration) + 0.25 × o (over-occupation marker) × 100 + 0.15 × l (low-power charging marker) × 100 + 0.15 × r (repeated charging marker) × 100 + 0.10 × a (number of historical abnormal times) × 10) × s (system coefficient).
Formula Explanation: The longer T is, the higher the probability of abnormality; when over-occupation o=1, the abnormal weight is significantly increased; when low-power charging l=1, it indicates unreasonable occupation, raising the warning level; repeated charging r=1 means frequent occupation, increasing the abnormal index; more historical abnormal times a indicate higher user behavior risk, thus increasing the comprehensive index; the system coefficient s is used for comprehensive adjustment according to the overall operation strategy.
4. Data Classification and Grading: Classify abnormal behaviors according to the P value:
- High-risk abnormality when P ≥ 100: immediately notify the management to take measures;
- Medium-risk abnormality when 50 ≤ P < 100: generate operation reports for scheduling reference;
- Low-risk abnormality when P < 50: only used for daily statistical analysis.
提供机构:
喜鹊云(浙江)数字科技有限公司
创建时间:
2025-09-28
搜集汇总
数据集介绍
背景与挑战
背景概述
该数据集包含绍兴区域电瓶车充电桩的800条异常充电行为记录,涵盖充电时间、时长、电量等字段,通过算法计算异常综合指数P来识别超时占用、低电量充电等风险行为,并划分风险等级。其应用场景包括物业调度优化、第三方平台预警和电网负荷分析,旨在提高充电桩使用效率和安全管理。
以上内容由遇见数据集搜集并总结生成


