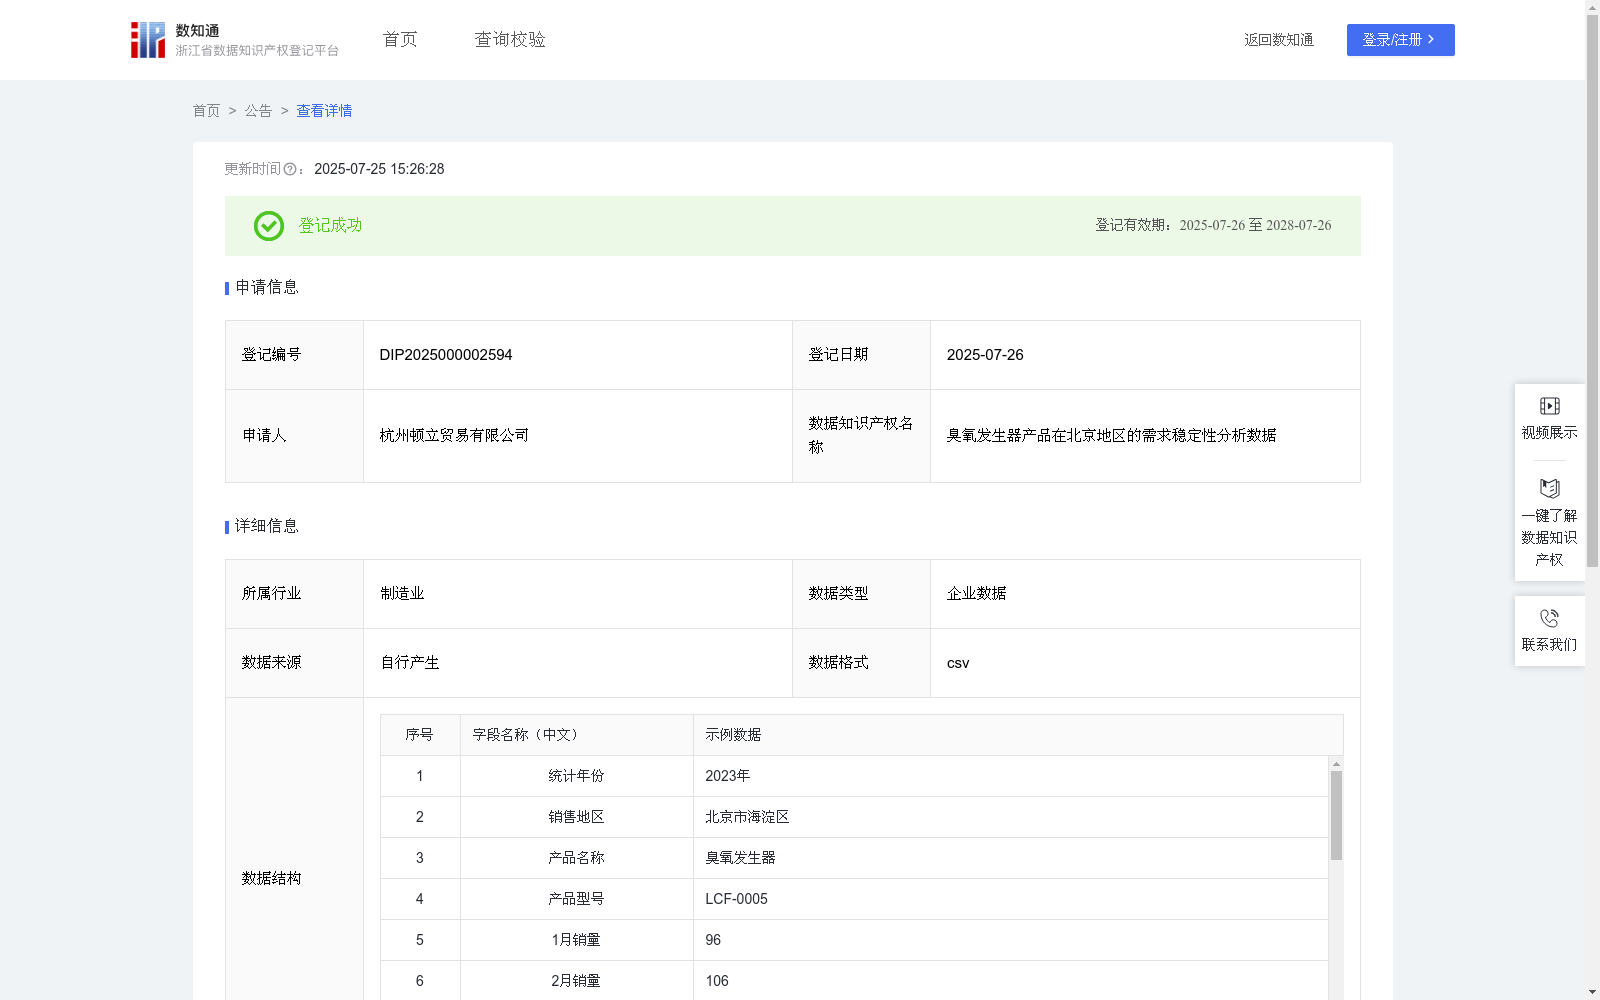
臭氧发生器产品在北京地区的需求稳定性分析数据
收藏浙江省数据知识产权登记平台2025-07-25 更新2025-07-26 收录
下载链接:
https://www.zjip.org.cn/home/announce/trends/154873
下载链接
链接失效反馈官方服务:
资源简介:
本数据对臭氧发生器产品的型号选择优化、精准库存管理、供应商协作、市场趋势预判及外部相关方决策支持等方面具有重要应用价值,具体应用场景如下:
1.型号选择优化与库存管理:通过稳定性分析数据,公司可识别北京江地区销售表现稳定的臭氧发生器型号,优先采购需求波动小的型号系列,降低滞销风险。同时,可针对稳定性高的型号建立动态安全库存,避免因需求激增导致的断货损失。
2.优化生产排期与库存策略:本数据可帮助臭氧发生器供应商优化生产排期,减少因需求波动导致的产能浪费。例如,针对北京地区需求稳定的型号,可提高生产优先级;对于季节性需求产品,则灵活调整备货节奏,降低库存积压风险。1.数据收集和预处理:(1)数据收集:收集公司臭氧发生器产品在北京地区的销售统计信息,具体包括统计年份、销售地区、产品名称、产品型号、1月销量、2月销量、3月销量、4月销量、5月销量、6月销量、7月销量、8月销量、9月销量、10月销量、11月销量、12月销量。(2)数据预处理:对采集到的原始数据进行处理,去除缺失和异常数据。
2.数据汇总:将1至12月的销量汇总,计算得到年度总销量。
3.建立稳定性分析模型:(1)计算月平均销售量:计算月平均销售量=年度总销量/12;(2)计算月销售量方差:月销售量方差=[(1月销量-月平均销售量)^2+(2月销量-月平均销售量)^2+(3月销量-月平均销售量)^2+…+(12月销量-月平均销售量)^2]/12;(3)稳定性分析:当方差小于1000,则分析结论为“产品需求很平稳”;当方差大于等于1000且小于等于2000,则分析结论为“产品需求一般平稳”;当方差大于2000,则分析结论为“产品需求波动大”。
This dataset holds significant application value for optimizing model selection of ozone generator products, precise inventory management, supplier collaboration, market trend forecasting, and decision support for external stakeholders. The specific application scenarios are as follows:
1. Model Selection Optimization and Inventory Management: Through stability analysis data, the company can identify ozone generator models with stable sales performance in the Beijing region, prioritize purchasing model series with small demand fluctuations to reduce the risk of unsold inventory. Meanwhile, dynamic safety stock can be established for models with high stability to avoid stockout losses caused by sudden demand surges.
2. Optimizing Production Scheduling and Inventory Strategy: This dataset can help ozone generator suppliers optimize production scheduling and reduce production capacity waste caused by demand fluctuations. For example, production priority can be elevated for models with stable demand in the Beijing region; for products with seasonal demand, the stocking rhythm can be flexibly adjusted to reduce the risk of inventory overstock.
The dataset development process is detailed below:
1. Data Collection and Preprocessing:
(1) Data Collection: Collect sales statistics of the company's ozone generator products in the Beijing region, including statistical year, sales region, product name, product model, sales volume in January, February, March, April, May, June, July, August, September, October, November, and December.
(2) Data Preprocessing: Process the collected raw data by removing missing and abnormal data.
2. Data Aggregation: Aggregate the sales volumes from January to December to calculate the annual total sales volume.
3. Establishment of Stability Analysis Model:
(1) Calculate monthly average sales volume: Monthly average sales volume = Annual total sales volume / 12;
(2) Calculate monthly sales variance: Monthly sales variance = [(Sales volume in January - Monthly average sales volume)^2 + (Sales volume in February - Monthly average sales volume)^2 + (Sales volume in March - Monthly average sales volume)^2 + … + (Sales volume in December - Monthly average sales volume)^2] / 12;
(3) Stability analysis: When the variance is less than 1000, the analysis conclusion is "product demand is very stable"; when the variance is greater than or equal to 1000 and less than or equal to 2000, the analysis conclusion is "product demand is generally stable"; when the variance is greater than 2000, the analysis conclusion is "product demand has large fluctuations".
提供机构:
杭州顿立贸易有限公司
创建时间:
2025-04-14
搜集汇总
数据集介绍
背景与挑战
背景概述
该数据集包含臭氧发生器产品在北京地区的月度销售数据及稳定性分析结果,适用于优化产品型号选择、库存管理和生产排期。数据格式为CSV,规模为512条,每年更新一次。
以上内容由遇见数据集搜集并总结生成


