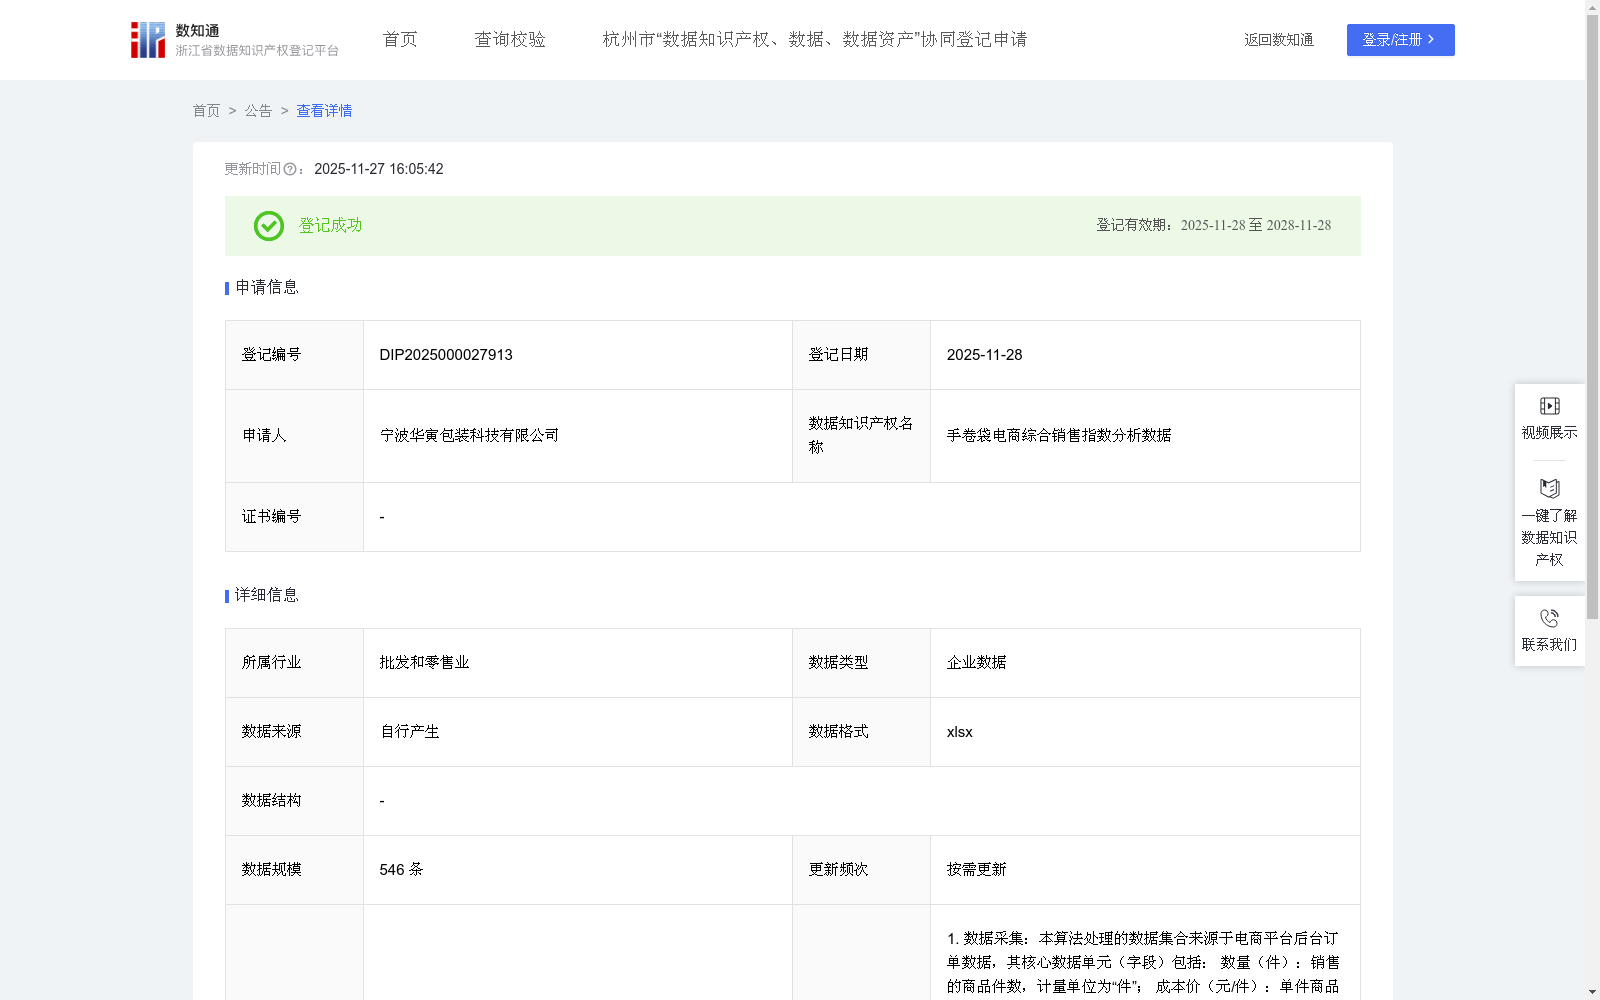
手卷袋电商综合销售指数分析数据
收藏浙江省数据知识产权登记平台2025-11-27 更新2025-11-28 收录
下载链接:
https://www.zjip.org.cn/home/announce/trends/8406893
下载链接
链接失效反馈官方服务:
资源简介:
通过分析本数据集合中的某月度(例如12月)平均综合销售指数及月总利润等核心指标,同业企业可建立行业基准参照系,客观评估自身在成本控制和定价策略等方面的经营管理水平,为优化产品结构提供数据支持。投资机构可借助月度综合销售指数的表现,准确评估包装制品细分领域的盈利能力和经营质量,为投资决策提供可靠的量化依据。上游供应商能够基于销售指数的表现特征,预判市场需求变化,科学制定产能规划与原材料采购计划,并通过分析成本结构对销售效益的影响,与下游企业建立更高效的协同合作模式。本数据集通过提供经过验证的行业基准指标,为产业链各参与方在战略规划、运营优化和资源配置等重要环节提供客观、准确的数据支撑。1. 数据采集:本算法处理的数据集合来源于电商平台后台订单数据,其核心数据单元(字段)包括:
数量(件):销售的商品件数,计量单位为“件”;
成本价(元/件):单件商品的成本,计量单位为“元/件”;
已付金额(元):商家实际收到的款项,即订单实收金额,计量单位为“元”;
上述核心单元将按某月度(例如12月)进行聚合。
2. 计算关键指标:基于上述聚合后的核心数据单元,通过以下公式计算核心效益指标:
月总已付金额(元):统计月份内商家实际收到的款项总额。
月总利润(元) = 月总已付金额(元) - ( 成本价(元/件) × 数量(件) )的月度汇总。
此指标直接反映该统计月份内扣除商品成本后的绝对利润额。
3. 计算综合销售指数:本算法的核心输出结果为“月度平均综合销售指数”,其计算公式为:
月度平均综合销售指数(%) = (月总利润(元) / 月总已付金额(元)) × 100。
为评估产品月度平均表现,可计算“月度平均综合销售指数(%)”,该平均指数数值越高,表明产品在销售方面的综合表现越优且越稳定。企业可根据这些指数评判该产品的销售效益,指数越高则证明销售策略的价值更大,有助于优化产品销售决策。
By analyzing core indicators such as the monthly average comprehensive sales index and total monthly profit of a specific month (e.g., December) in this dataset, peer enterprises can establish an industry benchmark reference system to objectively evaluate their own operation and management level in terms of cost control, pricing strategy and other aspects, and provide data support for optimizing product structure. Institutional investors can use the performance of the monthly comprehensive sales index to accurately evaluate the profitability and operation quality of the packaging products segment, providing reliable quantitative basis for investment decisions. Upstream suppliers can predict changes in market demand based on the performance characteristics of the sales index, scientifically formulate capacity planning and raw material procurement plans, and establish a more efficient collaborative cooperation model with downstream enterprises by analyzing the impact of cost structure on sales benefits. This dataset provides objective and accurate data support for all participants in the industrial chain in important links such as strategic planning, operation optimization and resource allocation by providing verified industry benchmark indicators.
1. Data Collection: The data set processed by this algorithm is sourced from the background order data of e-commerce platforms. Its core data units (fields) include:
- Quantity ("pcs"): Number of sold goods, with the unit of measurement "pcs";
- Cost price (yuan/piece): Cost of a single commodity, with the unit of measurement "yuan/piece";
- Paid amount (yuan): The actual amount received by the merchant, that is, the actual received amount of the order, with the unit of measurement "yuan";
The above core units will be aggregated according to a specific month (e.g., December).
2. Calculation of Key Indicators: Based on the aggregated core data units above, core benefit indicators are calculated through the following formulas:
Total monthly paid amount (yuan): The total amount actually received by the merchant within the statistical month.
Total monthly profit (yuan) = Total monthly paid amount (yuan) - Monthly total of (cost price (yuan/piece) × quantity ("pcs")).
This indicator directly reflects the absolute profit after deducting commodity costs in the statistical month.
3. Calculation of Comprehensive Sales Index: The core output result of this algorithm is the "monthly average comprehensive sales index", and its calculation formula is:
Monthly average comprehensive sales index (%) = (Total monthly profit (yuan) / Total monthly paid amount (yuan)) × 100.
To evaluate the monthly average performance of products, the "monthly average comprehensive sales index (%)" can be calculated. The higher the average index value, the better and more stable the comprehensive performance of the products in terms of sales. Enterprises can evaluate the sales efficiency of the products based on these indexes: the higher the index, the greater the value of the sales strategy, which helps to optimize product sales decisions.
提供机构:
宁波华寅包装科技有限公司
创建时间:
2025-10-21
搜集汇总
数据集介绍
背景与挑战
背景概述
该数据集是宁波华寅包装科技有限公司登记的企业数据,包含546条电商平台订单记录,格式为xlsx,用于计算月度综合销售指数和利润指标。它帮助同业企业评估成本控制和定价策略,投资机构分析盈利能力,以及供应商预判市场需求,为产业链各参与方提供数据支撑。
以上内容由遇见数据集搜集并总结生成


