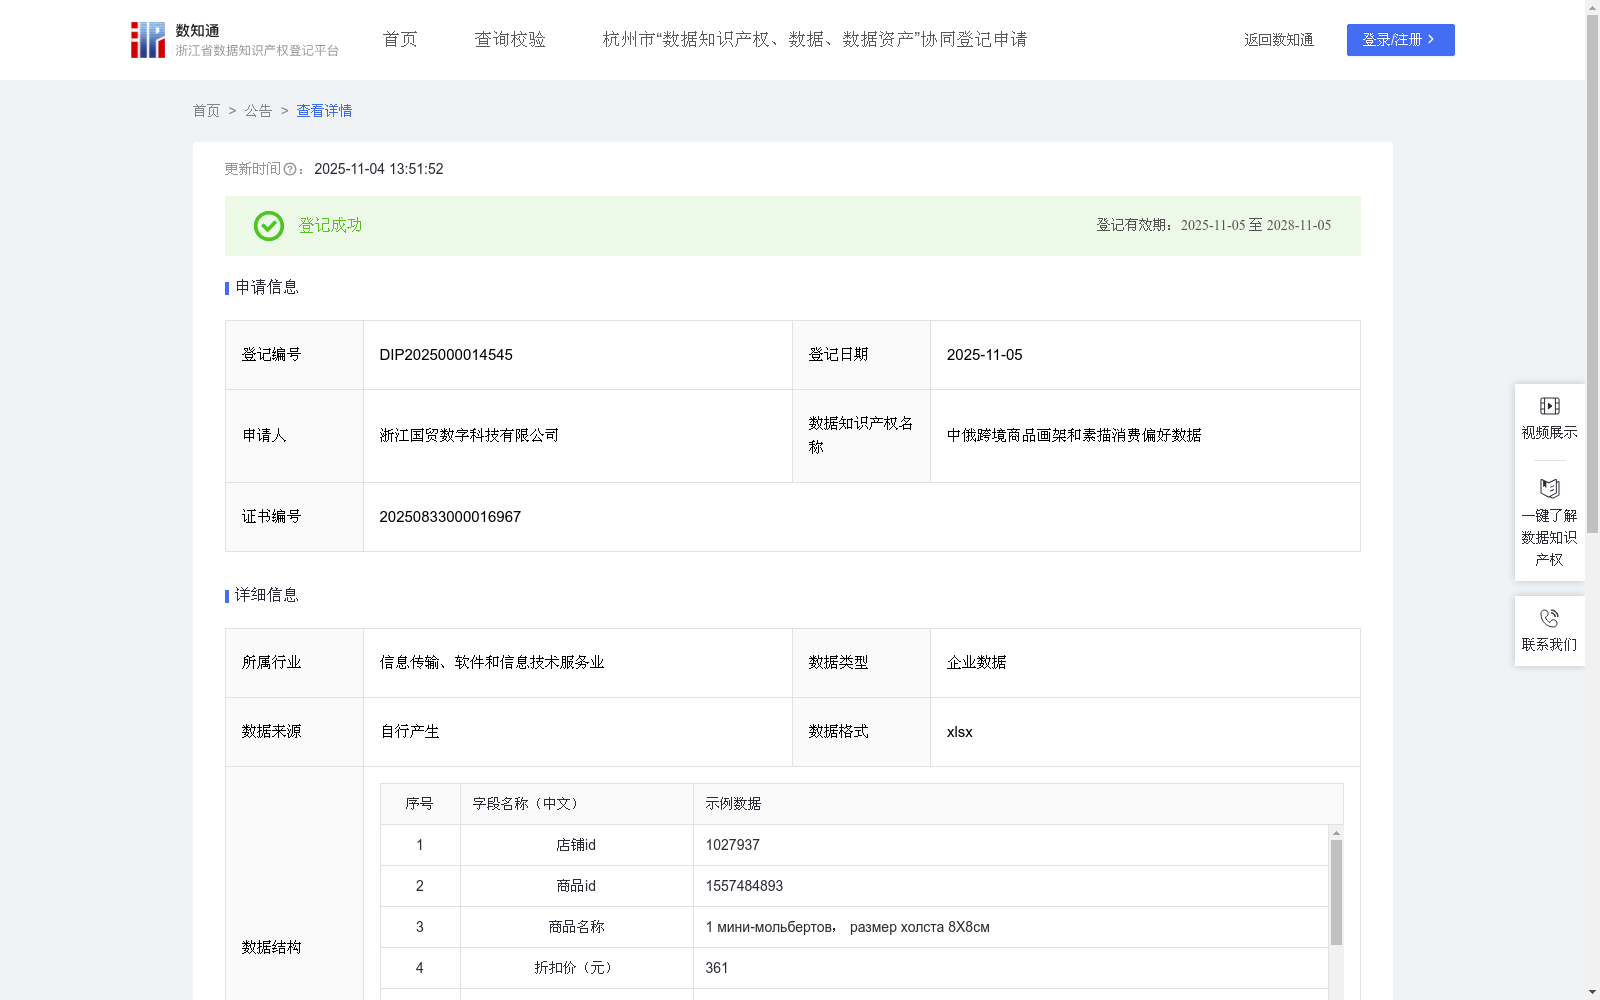
中俄跨境商品画架和素描消费偏好数据
收藏浙江省数据知识产权登记平台2025-11-04 更新2025-11-13 收录
下载链接:
https://www.zjip.org.cn/home/announce/trends/8391407
下载链接
链接失效反馈官方服务:
资源简介:
通过收集和分析中俄跨境商品销售对画架和素描品类交易行为的相关消费数据,了解中俄跨境商品销售中对画架和素描品类产品的需求偏好,针对高偏好分类产品采用多备货,低偏好分类产品减少库存等措施,从而为本行业的全链条企业制定生产销售策略提供数据支撑,更好地为客户提供个性化的商品和服务。1、数据采集:采集中俄跨境电商销售范围内,存在画架和素描品类产品消费行为,相关销售交易数据。2、数据处理,对采集到的数据进行分类、梳理,便于分析使用。3、算法加工:将处理后的数据进行分析:全品类平均销售金额=全品类销售总额/全品类销售总数量,某品类产品偏好指数L=(某品类产品销售总额/全品类平均销售金额)*(全品类销售总数量/全品类销售总额),“全品类销售总数量/全品类销售总额”是常数,用于将算法确定为基于全品类平均销售金额的需求量进行计算。数据为整理后状态,主要根据地区汇集,不完全按照时间先后顺序;订单可能存在捆绑/拼单/活动优惠,同品类产品单价在各区域、不同时间的差价忽略不计,因此全品类销售总额/全品类销售总数量≠某品类销售总额/某品类销售数量,依据行业经验采用全品类平均销售金额进行标准化算法处理。4、数据分类分级复用:根据计算出的偏好指数,L>5.0记为高偏好品类,1.0<L≤5.0记为中偏好品类,1.0≥L记为低偏好品类,根据地区等级安排更精准的生产营销策略,例如:加大高偏好品类的铺货量等。
This dataset is developed by collecting and analyzing relevant consumption data related to transaction behaviors of easel and sketching product categories in Sino-Russian cross-border commodity sales, aiming to figure out the demand preferences for such products in Sino-Russian cross-border commodity sales. Measures including increasing inventory for high-preference products and reducing inventory for low-preference products are implemented, so as to provide data support for full-chain enterprises in the industry to formulate production and sales strategies, and better deliver personalized products and services to customers.
1. Data Collection: Collect relevant sales transaction data corresponding to consumption behaviors of easel and sketching products within the scope of Sino-Russian cross-border e-commerce sales.
2. Data Processing: Classify and sort out the collected data to facilitate subsequent analysis and application.
3. Algorithm Processing: Analyze the processed data with the following rules and formulas:
- Average sales amount of all categories = Total sales amount of all categories / Total sales volume of all categories
- Preference Index L of a certain product category = (Total sales amount of the category / Average sales amount of all categories) * (Total sales volume of all categories / Total sales amount of all categories)
Note: The term (Total sales volume of all categories / Total sales amount of all categories) is a constant, which is used to standardize the algorithm to calculate demand based on the average sales amount of all categories. The data is in a consolidated state, mainly aggregated by region, and does not fully follow chronological order. Bundled orders, group purchases and promotional discounts may exist, and price differences of the same category products across regions and time periods are ignored. As a result, Total sales amount of all categories / Total sales volume of all categories ≠ Total sales amount of a certain category / Sales volume of the certain category. Therefore, the industry experience-based average sales amount of all categories is adopted for standardized algorithm processing.
4. Data Classification, Grading and Reuse: Based on the calculated Preference Index L, product categories are divided into three tiers: high-preference category (L > 5.0), medium-preference category (1.0 < L ≤ 5.0) and low-preference category (L ≤ 1.0). More precise production and marketing strategies are formulated according to regional levels, such as increasing the distribution volume of high-preference product categories.
提供机构:
浙江国贸数字科技有限公司
创建时间:
2025-08-11
搜集汇总
数据集介绍
以上内容由遇见数据集搜集并总结生成


