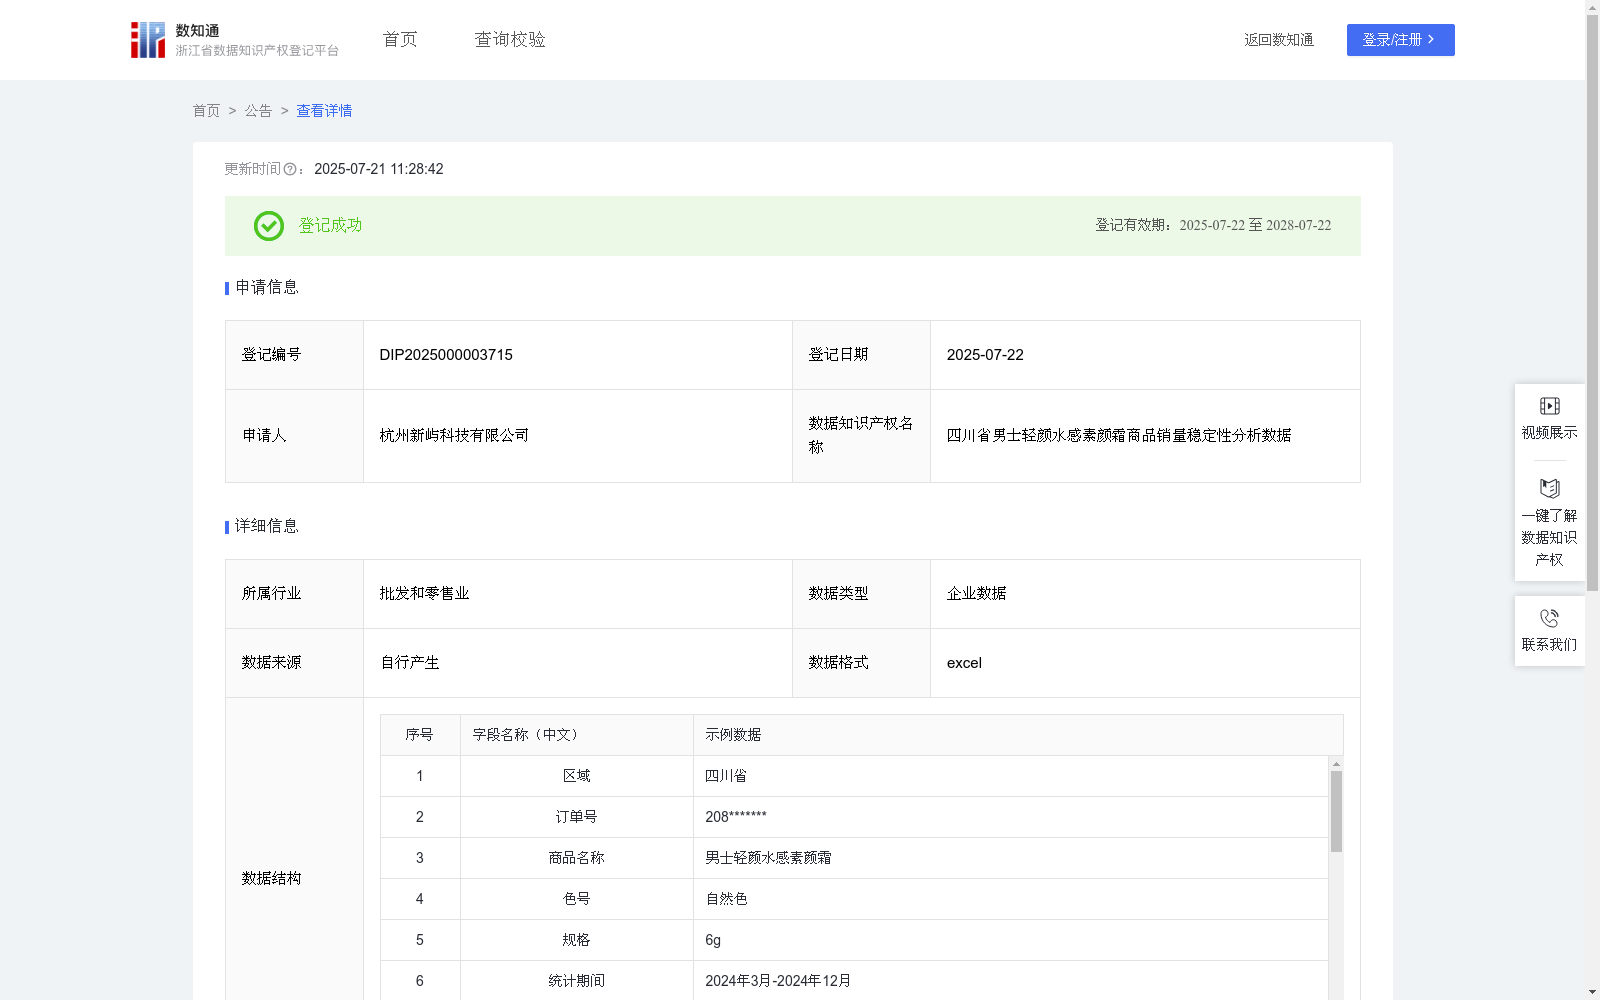
四川省男士轻颜水感素颜霜商品销量稳定性分析数据
收藏浙江省数据知识产权登记平台2025-07-21 更新2025-07-22 收录
下载链接:
https://www.zjip.org.cn/home/announce/trends/151975
下载链接
链接失效反馈官方服务:
资源简介:
某区域商品销量稳定性分析数据应用场景在于1、市场营销策略制定:通过分析商品在区域的销量稳定性,企业可以确定哪些商品销量稳定性好,便于企业学习。2、投资决策:投资者可以评估该商品的长期表现和风险。3、竞品分析:与竞争对手的商品销量稳定性进行对比,了解自身商品的优势和不足,制定针对性的竞争策略。4、商品评估:帮助企业了解商品在市场中的地位和影响力,为商品价值评估提供依据。1.数据收集和预处理:(1)数据收集:收集商品销量数据,具体包括区域、订单号、商品名称、色号、规格、付款时间、销量。(2)数据预处理:对采集到的原始数据进行处理,去除缺失和异常数据。 2.数据计算汇总:将该商品的月销量,其中销量计量单位是瓶,从3月-12月依次用X3...X10,X11,X12表示,并汇总计算得到总销量A。 3.建立销量稳定性分析模型:(1)计算月平均销量B:月平均销量B=A/10;(2)计算月平均销量方差S²:月平均销量方差S²=[(X3-B)^2+…+(X12-B)^2]/10;(3)销量稳定性分析:当S²小于10000,则分析结论为“销量很平稳”;当S²大于等于10000且小于20000,则分析结论为“销量一般稳定”,当S²大于等于20000,则分析结论为”销量波动大”。
This dataset for regional commodity sales stability analysis is applicable to the following scenarios: 1. Marketing strategy formulation: By analyzing the sales stability of commodities in a specific region, enterprises can identify commodities with stable sales performance for reference and learning. 2. Investment decision-making: Investors can evaluate the long-term performance and associated risks of the commodities. 3. Competitive product analysis: Compare the sales stability of self-owned commodities with that of competitors to identify their own advantages and shortcomings, and formulate targeted competitive strategies. 4. Commodity evaluation: Assist enterprises in understanding the market position and influence of commodities, providing a basis for commodity value assessment. 1. Data collection and preprocessing: (1) Data collection: Collect commodity sales data, including region, order number, commodity name, color code, specification, payment time, and sales volume. (2) Data preprocessing: Process the collected raw data by removing missing and abnormal records. 2. Data calculation and summarization: Calculate the monthly sales of the commodities, where sales volume is measured in bottles. The monthly sales from March to December are sequentially denoted as X3, X4, ..., X10, X11, X12 respectively, and the total sales A is obtained through summarization and calculation. 3. Establishment of sales stability analysis model: (1) Calculate the monthly average sales B: Monthly average sales B = A / 10; (2) Calculate the monthly average sales variance S²: S² = [(X3 - B)² + … + (X12 - B)²] / 10; (3) Sales stability analysis: When S² < 10000, the analysis conclusion is "Sales are very stable"; When 10000 ≤ S² < 20000, the analysis conclusion is "Sales are generally stable"; When S² ≥ 20000, the analysis conclusion is "Sales have large fluctuations".
提供机构:
杭州新屿科技有限公司
创建时间:
2025-04-27
搜集汇总
数据集介绍
以上内容由遇见数据集搜集并总结生成


