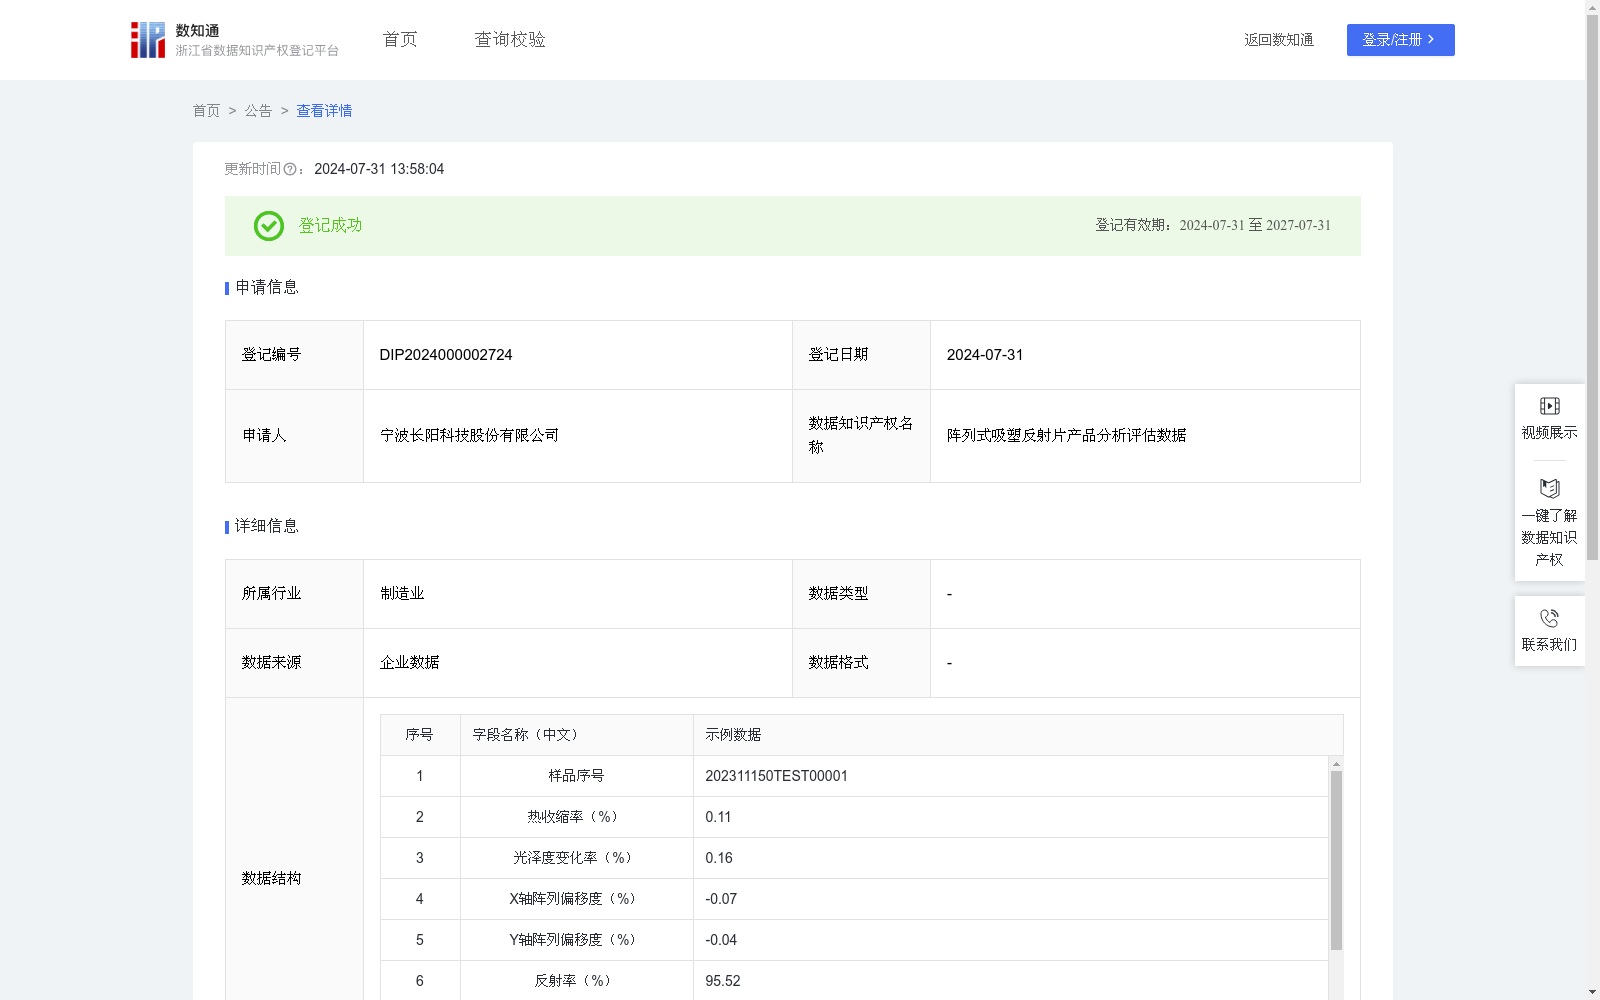
阵列式吸塑反射片产品分析评估数据
收藏浙江省数据知识产权登记平台2024-07-31 更新2024-08-01 收录
下载链接:
https://www.zjip.org.cn/home/announce/trends/46251
下载链接
链接失效反馈官方服务:
资源简介:
通过对阵列式吸塑反射片产品的性能数据进行深入分析,评估了产品的优质品、合格品、瑕疵品,有助于企业内部优化生产流程,提高产品质量,确保产品符合严格的行业标准,这不仅增强了企业的市场竞争力,也为持续的创新和产品研发提供了数据支持,同时企业也可与同行业的其他公司就此类产品进行合作交流,从多维度分析产品参数,在现有标准的基础上进一步以更高更完善的标准共同提升产品质量和技术水平,从而促进建立和更新行业标准。1数据采集处理:数据由检测中心与研究院通过数据系统收集计算,得热收缩率a%、光泽度变化率b%、X轴阵列偏移度c%、Y轴阵列偏移度d%、反射率e%、表面电阻f*10^11、黄度指数g,具体计算参考相关国家行业标准,以X轴阵列偏移度举例,在10米样品中沿X轴方向选取100个点进行偏移距离检测,计算测量点与标准点的偏移距离差,将所有偏移距离差的绝对值求和除以100,再除以10m得X轴阵列偏移度。2等级评估:评估分=Ax20x(0.5-|a|)+Bx10x(1-|b|)+Cx5x(1.2-|c|)+Dx5x(1.2-|d|)+Ex|e|/10+Fx10xf+Gx(10-|g|),ABCDEFG为各检测项目权重,通过方差分析法评估不同项目对产品影响度,分别计算abcdefg数据集方差,方差越大说明该项目对产品影响度越高,权重越大,通过比例划分,保证ABCDEFG和为100,目前ABCDEFG为18.3、14.4、10.1、10.5、15.2、14.5、17;产品评估分达900分为优质品、达700分为合格品,未达700分为瑕疵品。3数据应用:通过多维评估产品品质,以更优标准提升产品质量和技术水平。
This study conducts an in-depth analysis of the performance data of array-type blister reflective sheet products, and classifies the products into premium, qualified and defective grades. This work helps enterprises optimize internal production processes, improve product quality, and ensure that products meet strict industry standards. It not only enhances the market competitiveness of enterprises, but also provides data support for continuous innovation and product research and development. Meanwhile, enterprises can carry out cooperation and exchanges with other companies in the same industry regarding such products, analyze product parameters from multiple dimensions, and jointly improve product quality and technical level with higher and more comprehensive standards based on existing standards, thereby promoting the establishment and update of industry standards.
1. Data Collection and Processing: The data is collected and calculated by the testing center and research institute through the data system. The obtained indicators include thermal shrinkage rate a%, gloss change rate b%, X-axis array deviation c%, Y-axis array deviation d%, reflectivity e%, surface resistance f×10^11, and yellowness index g. The specific calculation methods refer to relevant national and industry standards. Take the X-axis array deviation as an example: 100 points are selected along the X-axis direction from a 10-meter sample for offset distance detection. Calculate the offset distance difference between each measured point and the standard point, sum the absolute values of all offset distance differences, divide the total sum by 100, then divide the result by 10 meters to obtain the X-axis array deviation.
2. Grade Evaluation: The comprehensive evaluation score is calculated as: Score = A×20×(0.5-|a|) + B×10×(1-|b|) + C×5×(1.2-|c|) + D×5×(1.2-|d|) + E×|e|/10 + F×10×f + G×(10-|g|), where A, B, C, D, E, F, G are the weights of each testing item. The impact of each item on the product is evaluated through analysis of variance (ANOVA): the variance of the a, b, c, d, e, f, g datasets is calculated respectively, and the larger the variance, the higher the impact of the corresponding item on the product, thus the greater its weight. The weights are assigned proportionally to ensure that the sum of A, B, C, D, E, F, G is 100. The current weight values are 18.3, 14.4, 10.1, 10.5, 15.2, 14.5, and 17 respectively. Products with a score of 900 or above are classified as premium, those with a score between 700 and 899 are qualified, and those with a score below 700 are defective.
3. Data Application: Carry out multi-dimensional evaluation of product quality to improve product quality and technical level with more optimized standards.
提供机构:
宁波长阳科技股份有限公司
创建时间:
2024-07-05
搜集汇总
数据集介绍
特点
该数据集包含阵列式吸塑反射片产品的详细性能评估数据,涵盖多个关键参数如热收缩率、光泽度变化率等,用于产品质量分级和优化生产流程。数据每日更新,规模为17097条,主要应用于制造业,旨在提升产品质量和行业标准。
以上内容由遇见数据集搜集并总结生成


