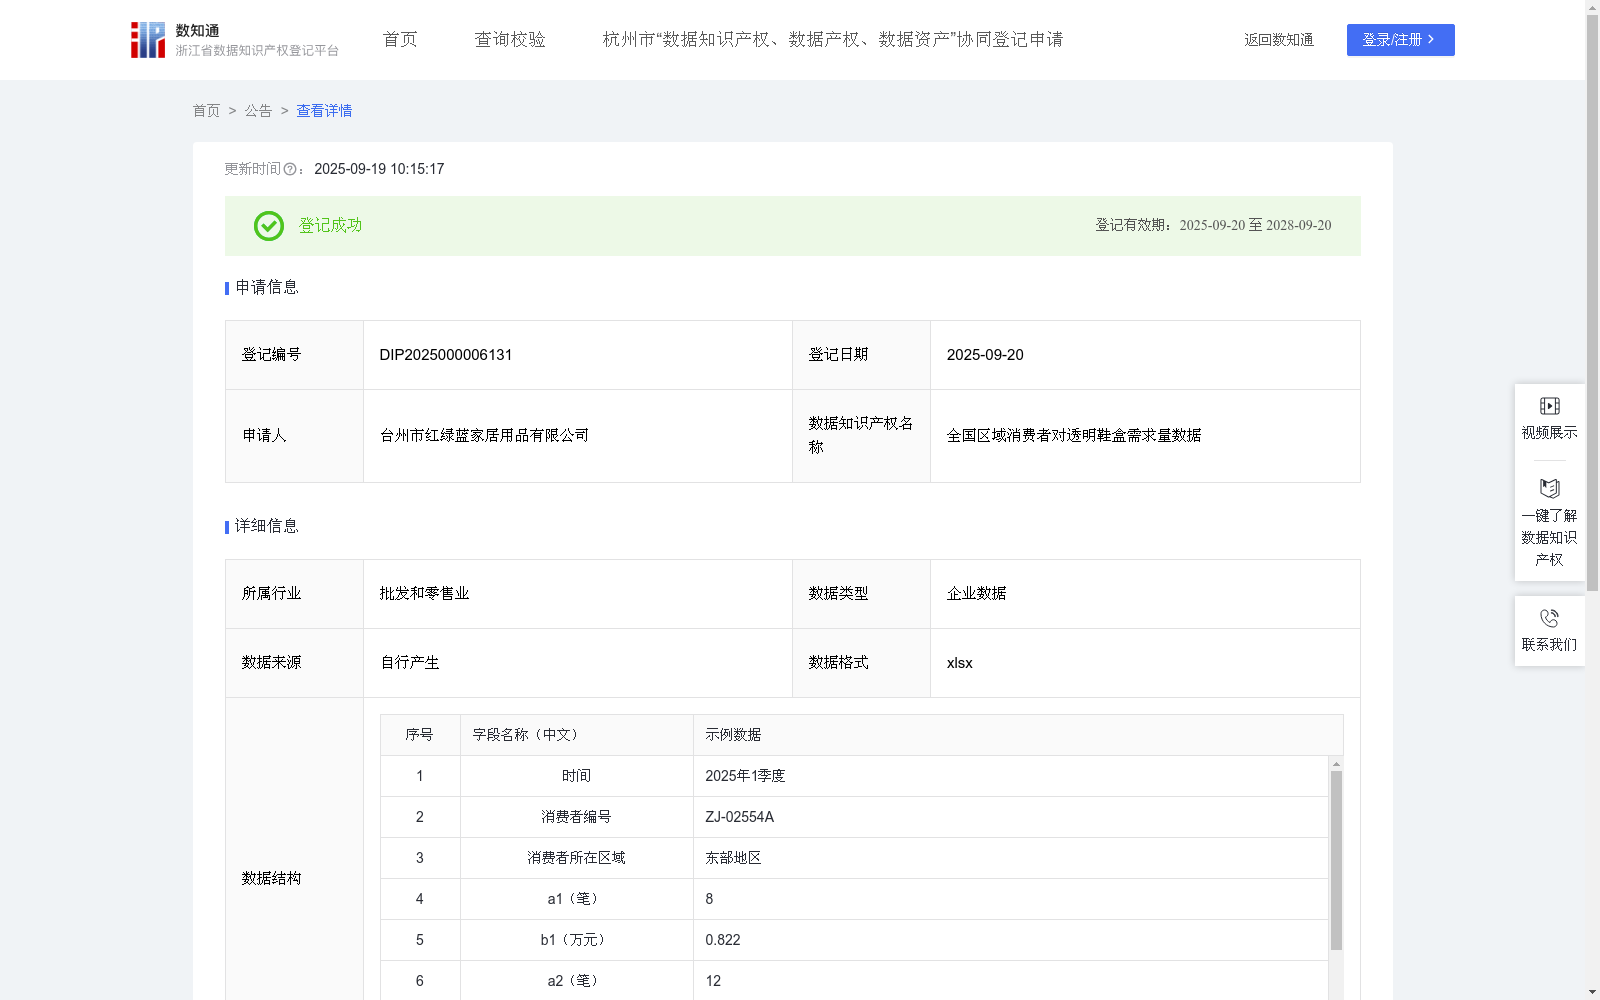
全国区域消费者对透明鞋盒需求量数据
收藏浙江省数据知识产权登记平台2025-09-19 更新2025-09-20 收录
下载链接:
https://www.zjip.org.cn/home/announce/trends/182708
下载链接
链接失效反馈官方服务:
资源简介:
通过收集和分析全国区域消费者对透明鞋盒的消费相关数据,了解消费者对透明鞋盒的购买力水平和消费偏好,从而了解该产品是否畅销,从而为本行业的所有消费者制定服务策略,更好地为用户提供个性化的商品和服务。帮助公司更好地理解消费者,高等级消费者可每月1至2次与消费者沟通,中等级可每季度1至2次与消费者沟通,低等级消费者可每半年1至2次与消费者沟通,从而制定更精准的生产营销策略。1.数据采集:采集平时消费者每季度对透明鞋盒的相关交易数据。2.数据处理:对采集到数据进行分类、合并、累加,便于分析使用。3.算法加工:将处理后的数据进行需求量分析:需求指数P={a1(单笔最少订单数量)/b1(单笔最少消费额度)+a2(单笔最高订单数量)/b2(单笔最高消费额度))}*k,k为消费系数,消费者归属于不同的经济区域k值不同,全国分为四大经济区域:东部地区、东北地区、中部地区和西部地区,按经验取值东部地区k值为1.1,东北和中部地区k值为1.15,西部地区k值为1.2。4、数据分类分级:根据计算出的需求指数,将消费者等级划分为“高、中、低”不同的类别和级别(30分以上标记为“高等级”,20-30分区间内标记为“中等级”,20分以下标记为“低等级”)。
This dataset is developed by collecting and analyzing regional consumer consumption data related to transparent shoe boxes across China. Its objectives include: understanding consumers' purchasing power levels and consumption preferences for transparent shoe boxes, evaluating the market sales performance of the product, formulating service strategies for all consumers in the industry to deliver better personalized products and services, and assisting enterprises in gaining deeper consumer insights. Specifically, targeted communication frequencies are set for different consumer tiers: "high-tier" consumers can be contacted 1 to 2 times per month, "mid-tier" consumers 1 to 2 times per quarter, and "low-tier" consumers 1 to 2 times every six months, so as to support the formulation of more precise production and marketing strategies.
The dataset construction workflow consists of four main steps:
1. Data Collection: Collect quarterly transaction data related to transparent shoe boxes from consumers.
2. Data Processing: Classify, merge and accumulate the collected data to facilitate subsequent analysis.
3. Algorithm-based Demand Analysis: Calculate the demand index P using the formula: P = { (a1 / b1) + (a2 / b2) } * k, where a1 refers to the minimum single-order quantity, b1 refers to the minimum single-order consumption amount, a2 refers to the maximum single-order quantity, b2 refers to the maximum single-order consumption amount, and k is the consumption coefficient. The value of k varies across four major economic regions in China: Eastern Region, Northeast Region, Central Region and Western Region. Based on empirical experience, the k values are set as 1.1 for the Eastern Region, 1.15 for both the Northeast and Central Regions, and 1.2 for the Western Region.
4. Data Classification and Grading: Divide consumers into three tiers based on the calculated demand index: "high-tier" for consumers with a score above 30, "mid-tier" for those with a score within the range of 20 to 30, and "low-tier" for those with a score below 20.
提供机构:
台州市红绿蓝家居用品有限公司
创建时间:
2025-05-26
搜集汇总
数据集介绍
背景与挑战
背景概述
该数据集包含7946条全国消费者对透明鞋盒的需求记录,每季度更新,涵盖区域、订单数量和消费额度等字段,通过需求指数算法将消费者分为高、中、低等级,用于分析购买偏好和制定精准营销策略。
以上内容由遇见数据集搜集并总结生成


