办公椅扶手质量风险预测预警数据
收藏浙江省数据知识产权登记平台2024-12-20 更新2024-12-21 收录
下载链接:
https://www.zjip.org.cn/home/announce/trends/107212
下载链接
链接失效反馈官方服务:
资源简介:
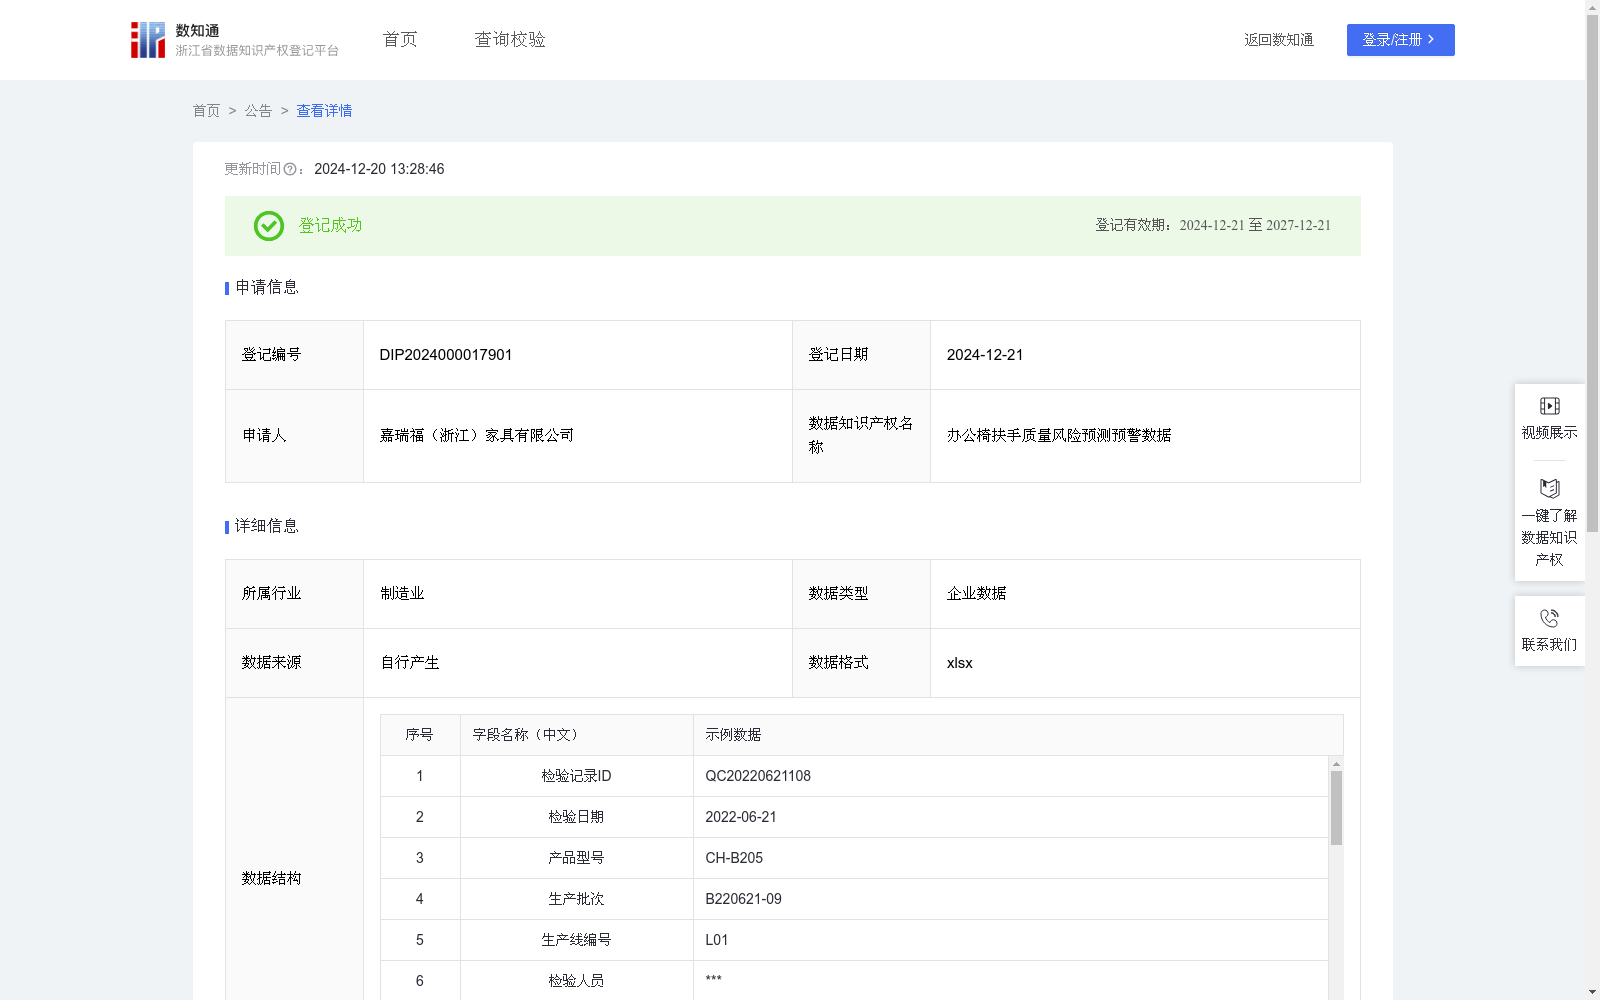
办公椅扶手质量风险预测预警数据聚焦于办公椅扶手强度等关键质量指标的风险评估。这些数据通过记录和分析检验结果、不合格情况、风险趋势等多维度信息,为办公椅生产企业提供质量管理决策支持。企业可基于这些数据了解扶手产品的整体质量状况,通过分析累计不合格次数、不合格率、连续不合格次数及其占比等指标,及时调整生产工艺,改进原材料选择,加强质量控制,从而降低产品缺陷率和返工风险,提高市场竞争力。质量管理部门可利用这些数据识别和跟踪潜在质量问题,及时采取管理措施,通过质量风险评分和趋势分析,可预见可能出现的质量波动,提前调整生产计划或增加检查频率,当风险评分显示异常时,及时发出质量预警,加强控制力度。这些数据对其他企业也具有重要价值:办公椅制造企业可直接参考风险评分标准,快速建立自身的质量预警机制,了解行业质量控制水平,明确自身提升目标,借鉴不合格原因分析方法,完善质量管理体系;办公家具经销商可将其作为评估供应商质量管理能力的重要参考,帮助制定产品质量验收标准,降低采购质量风险;配件供应商则可了解下游企业的质量要求标准,指导产品研发和质量改进方向,提升配件产品竞争力。1. 数据采集和预处理:
(1)数据采集:采集办公椅扶手产品每次送检的结果数据,包括检验记录ID、检验日期、产品型号、生产批次、生产线编号、检验人员、检验项目、检验结果、不合格原因、备注等信息。(2)数据预处理:将检验结果转换为二值数据:合格=0,不合格=1(对应字段"检验结果_二值")。
2.数据加工和分析:(1)基础指标计算:a.样本量:最近100次检验记录数;b.累计不合格次数:最近100次检验中不合格的总数;c.累计不合格率 = (累计不合格次数/样本量) × 100%; d.最高连续不合格次数:计算最近100次检验中的最长连续不合格次数;e.最高连续不合格次数占比 = (最高连续不合格次数/样本量) × 100%。
(2)预测预警模型:a.质量风险评分计算:1)当前风险值t = (累计不合格率 × 0.6) + (最高连续不合格次数占比 × 0.4); 2)EMAt = 0.2×当前风险t + 0.8 × EMAt-1; b.趋势分析:1)EMA_10天均值:最近10天的EMA平均值;2)EMA_前10天均值:前10天的EMA平均值 - 趋势指标 = (EMA_10天均值 - EMA_前10天均值) / 10; c.风险评估:1)综合风险评分 = EMAt + (趋势指标 × 0.5);2)风险等级判定:综合风险评分≤5,为低风险;5<综合风险评分≤10,为中风险;10<综合风险评分≤15,为高风险;综合风险评分>15,为极高风险。
Office Chair Armrest Quality Risk Prediction and Early Warning Dataset focuses on risk assessment of key quality indicators such as the strength of office chair armrests. By recording and analyzing multi-dimensional information including test results, non-conformity situations, and risk trends, this dataset provides quality management decision support for office chair manufacturing enterprises. Enterprises can use this data to understand the overall quality status of armrest products, adjust production processes, improve raw material selection, and strengthen quality control by analyzing indicators such as cumulative non-conformity times, non-conformity rate, consecutive non-conformity times and their proportions, thereby reducing product defect rates and rework risks and enhancing market competitiveness. Quality management departments can use this data to identify and track potential quality issues, take timely management measures, predict possible quality fluctuations through quality risk scores and trend analysis, adjust production plans in advance or increase inspection frequency, and issue quality warnings and strengthen control when risk scores show abnormalities. This dataset also holds important value for other enterprises: office chair manufacturing enterprises can directly refer to the risk scoring standards to quickly establish their own quality early warning mechanisms, understand the industry's quality control level, clarify their own improvement goals, draw lessons from non-conformity cause analysis methods, and improve their quality management systems; office furniture distributors can use it as an important reference for evaluating suppliers' quality management capabilities, help formulate product quality acceptance standards, and reduce procurement quality risks; accessory suppliers can understand the quality requirements of downstream enterprises, guide product R&D and quality improvement directions, and enhance the competitiveness of accessory products.
1. Data Collection and Preprocessing:
(1) Data Collection: Collect the test result data of each batch of office chair armrest products sent for inspection, including information such as inspection record ID, inspection date, product model, production batch, production line number, inspector, inspection items, inspection results, non-conformity causes, and remarks.
(2) Data Preprocessing: Convert the inspection results into binary data: qualified = 0, non-conforming = 1 (corresponding to the field "Inspection Result_Binary").
2. Data Processing and Analysis:
(1) Basic Indicator Calculation:
a. Sample Size: The number of inspection records in the most recent 100 times;
b. Cumulative Non-Conformity Times: The total number of non-conforming items in the most recent 100 inspections;
c. Cumulative Non-Conformity Rate = (Cumulative Non-Conformity Times / Sample Size) × 100%;
d. Maximum Consecutive Non-Conformity Times: Calculate the longest consecutive non-conformity times in the most recent 100 inspections;
e. Proportion of Maximum Consecutive Non-Conformity Times = (Maximum Consecutive Non-Conformity Times / Sample Size) × 100%.
(2) Prediction and Early Warning Model:
a. Quality Risk Score Calculation:
1) Current Risk Value t = (Cumulative Non-Conformity Rate × 0.6) + (Proportion of Maximum Consecutive Non-Conformity Times × 0.4);
2) EMAt = 0.2 × Current Risk Value t + 0.8 × EMAt-1;
b. Trend Analysis:
1) 10-Day EMA Average: The average EMA value of the most recent 10 days;
2) Previous 10-Day EMA Average: The average EMA value of the 10 days prior; Trend Indicator = (10-Day EMA Average - Previous 10-Day EMA Average) / 10;
c. Risk Assessment:
1) Comprehensive Risk Score = EMAt + (Trend Indicator × 0.5);
2) Risk Level Judgment: Low risk when Comprehensive Risk Score ≤5; Medium risk when 5 < Comprehensive Risk Score ≤10; High risk when 10 < Comprehensive Risk Score ≤15; Extreme risk when Comprehensive Risk Score >15.
提供机构:
嘉瑞福(浙江)家具有限公司
创建时间:
2024-12-01
搜集汇总
数据集介绍
特点
该数据集为办公椅扶手质量风险预测预警数据,包含932条记录,每年更新一次。数据通过记录和分析检验结果、不合格情况、风险趋势等信息,帮助企业进行质量管理决策,评估产品质量风险。
以上内容由遇见数据集搜集并总结生成


