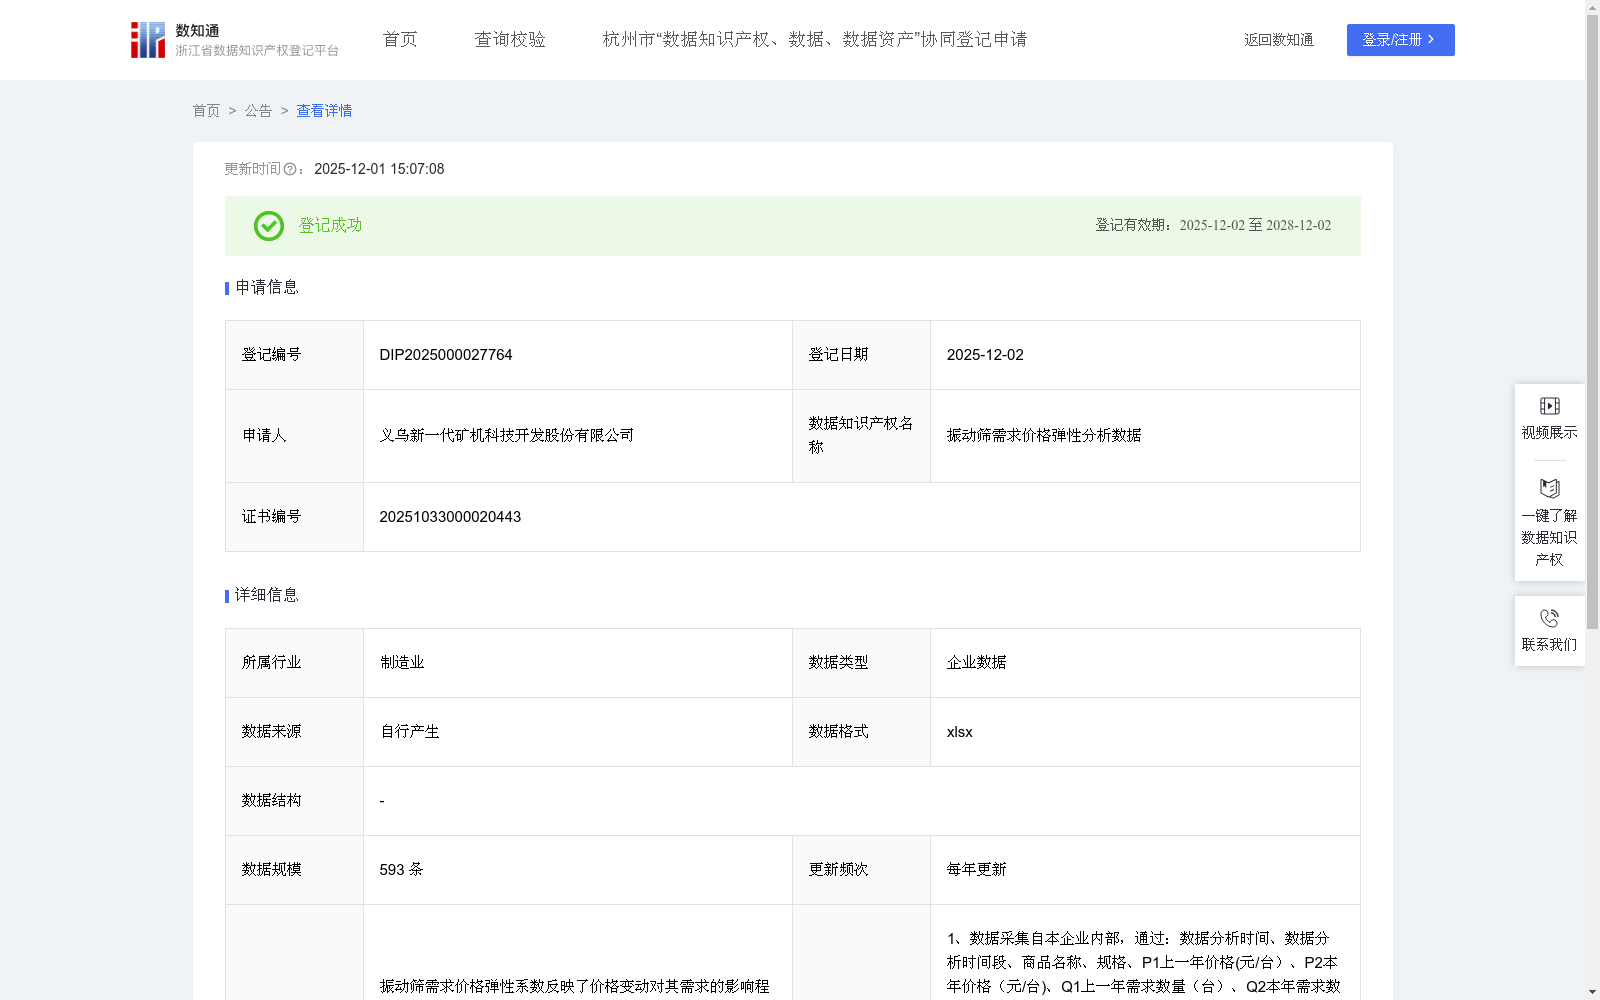
振动筛需求价格弹性分析数据
收藏浙江省数据知识产权登记平台2025-12-01 更新2025-12-02 收录
下载链接:
https://www.zjip.org.cn/home/announce/trends/8407898
下载链接
链接失效反馈官方服务:
资源简介:
振动筛需求价格弹性系数反映了价格变动对其需求的影响程度,主要应用于: 1. 建筑、矿山等下游行业可通过数据预判振动筛价格波动对自身矿机设备采购成本的影响,比如弹性系数高时,小幅涨价就会减少需求,行业可提前锁定采购合同,控制项目总成本。 2. 行业协会或联盟能依据数据监测市场热度,若弹性系数低(需求对价格不敏感),说明行业需求刚性,可引导上游合理扩产;若弹性高,则提示避免过度涨价引发需求萎缩。 3、生产企业可据此制定价格策略,弹性高时需谨慎涨价,优先通过规模降本;同时结合数据调整产能,避免弹性低时产能不足、弹性高时产能过剩。 4、上、下游企业可利用数据优化库存,弹性低时可适当备货应对刚性需求,弹性高时则减少库存,降低价格波动带来的滞销风险。1、数据采集自本企业内部,通过:数据分析时间、数据分析时间段、商品名称、规格、P1上一年价格(元/台)、P2本年价格(元/台)、Q1上一年需求数量(台)、Q2本年需求数量(台)。对数据进行清洗,去除异常值、消除重复数据,确保数据的准确性和完整性。2、建立|Ed|需求价格弹性系数模型: |Ed| =| [(Q2 - Q1)/((Q1 + Q2)/2)] / [(P2 - P1)/((P1 + P2)/2)] | 。P1为上一年价格(元/台);P2为本年价格(元/台);Q1为上一年需求数量(台);Q2 为本年需求数量(台), 3、数据运用:(1)富有弹性:|Ed| >1,表明数量变动大于价格变动,意味着需要调整价格策略。 (2)缺乏弹性:|Ed| <1,即数量变动小于价格变动,说明价格变动对数量影响较小。 (3)完全弹性:|Ed| =∞,表示价格的微小变动会引起数量的无穷大变动, (4)单位弹性:|Ed| =1,此时数量变动与价格变动相等 (5)完全无弹性:|Ed| =0,数量对价格变动毫无反应。4、|Ed|反映了数量变动对于价格变动的反应程度,即价格上升或下降时,需求数量的变化情况。
The price elasticity of demand coefficient for vibrating screens reflects the degree to which price changes affect their demand, and is mainly applied in the following aspects:
1. Downstream industries such as construction and mining can use the data to predict the impact of vibrating screen price fluctuations on their own mining machinery equipment procurement costs. For example, when the elasticity coefficient is high, even a small price increase will reduce demand, and the industry can lock in procurement contracts in advance to control the total project cost.
2. Industry associations or alliances can monitor market sentiment based on the data. If the elasticity coefficient is low (demand is insensitive to price changes), it indicates rigid industry demand, and upstream enterprises can be guided to expand production rationally; if the elasticity coefficient is high, it reminds to avoid excessive price increases that trigger demand contraction.
3. Manufacturing enterprises can formulate pricing strategies accordingly. When the elasticity is high, price increases should be made cautiously, and prioritize cost reduction through economies of scale; meanwhile, production capacity can be adjusted based on the data to avoid insufficient production capacity when elasticity is low and overcapacity when elasticity is high.
4. Upstream and downstream enterprises can use the data to optimize inventory. When elasticity is low, appropriate inventory reserves can be made to meet rigid demand; when elasticity is high, inventory should be reduced to lower the risk of unsold goods caused by price fluctuations.
1. Data is collected from the enterprise's internal systems, including: data analysis time, data analysis time period, product name, product specification, P1: price in the previous year (yuan/unit), P2: price in the current year (yuan/unit), Q1: demand quantity in the previous year (units), Q2: demand quantity in the current year (units). Data cleaning is performed to remove outliers and eliminate duplicate data, ensuring the accuracy and integrity of the dataset.
2. Establish the |E_d| price elasticity of demand coefficient model: |E_d| = | [(Q2 - Q1) / ((Q1 + Q2)/2)] / [(P2 - P1) / ((P1 + P2)/2)] |. Where P1 is the price in the previous year (yuan/unit); P2 is the price in the current year (yuan/unit); Q1 is the demand quantity in the previous year (units); Q2 is the demand quantity in the current year (units).
3. Data application:
(1) Elastic demand: |E_d| > 1, indicating that the change in quantity is greater than the change in price, meaning that the pricing strategy needs to be adjusted.
(2) Inelastic demand: |E_d| < 1, that is, the change in quantity is smaller than the change in price, indicating that price changes have a relatively small impact on quantity.
(3) Perfectly elastic demand: |E_d| = ∞, which means that a tiny change in price will cause an infinitely large change in quantity.
(4) Unit elastic demand: |E_d| = 1, at which point the change in quantity is equal to the change in price.
(5) Perfectly inelastic demand: |E_d| = 0, meaning that quantity does not respond at all to price changes.
4. |E_d| reflects the degree of response of quantity changes to price changes, that is, the change in demand quantity when prices rise or fall.
提供机构:
义乌新一代矿机科技开发股份有限公司
创建时间:
2025-10-20
搜集汇总
数据集介绍
背景与挑战
背景概述
该数据集由义乌新一代矿机科技开发股份有限公司提供,包含593条振动筛设备的需求价格弹性分析数据,以xlsx格式存储并每年更新。数据集通过计算需求价格弹性系数(|Ed|),量化价格变动对需求数量的影响程度,主要应用于建筑、矿山等下游行业的成本预测、行业协会的市场监测以及生产企业的价格策略制定,帮助优化采购、产能和库存管理。
以上内容由遇见数据集搜集并总结生成


