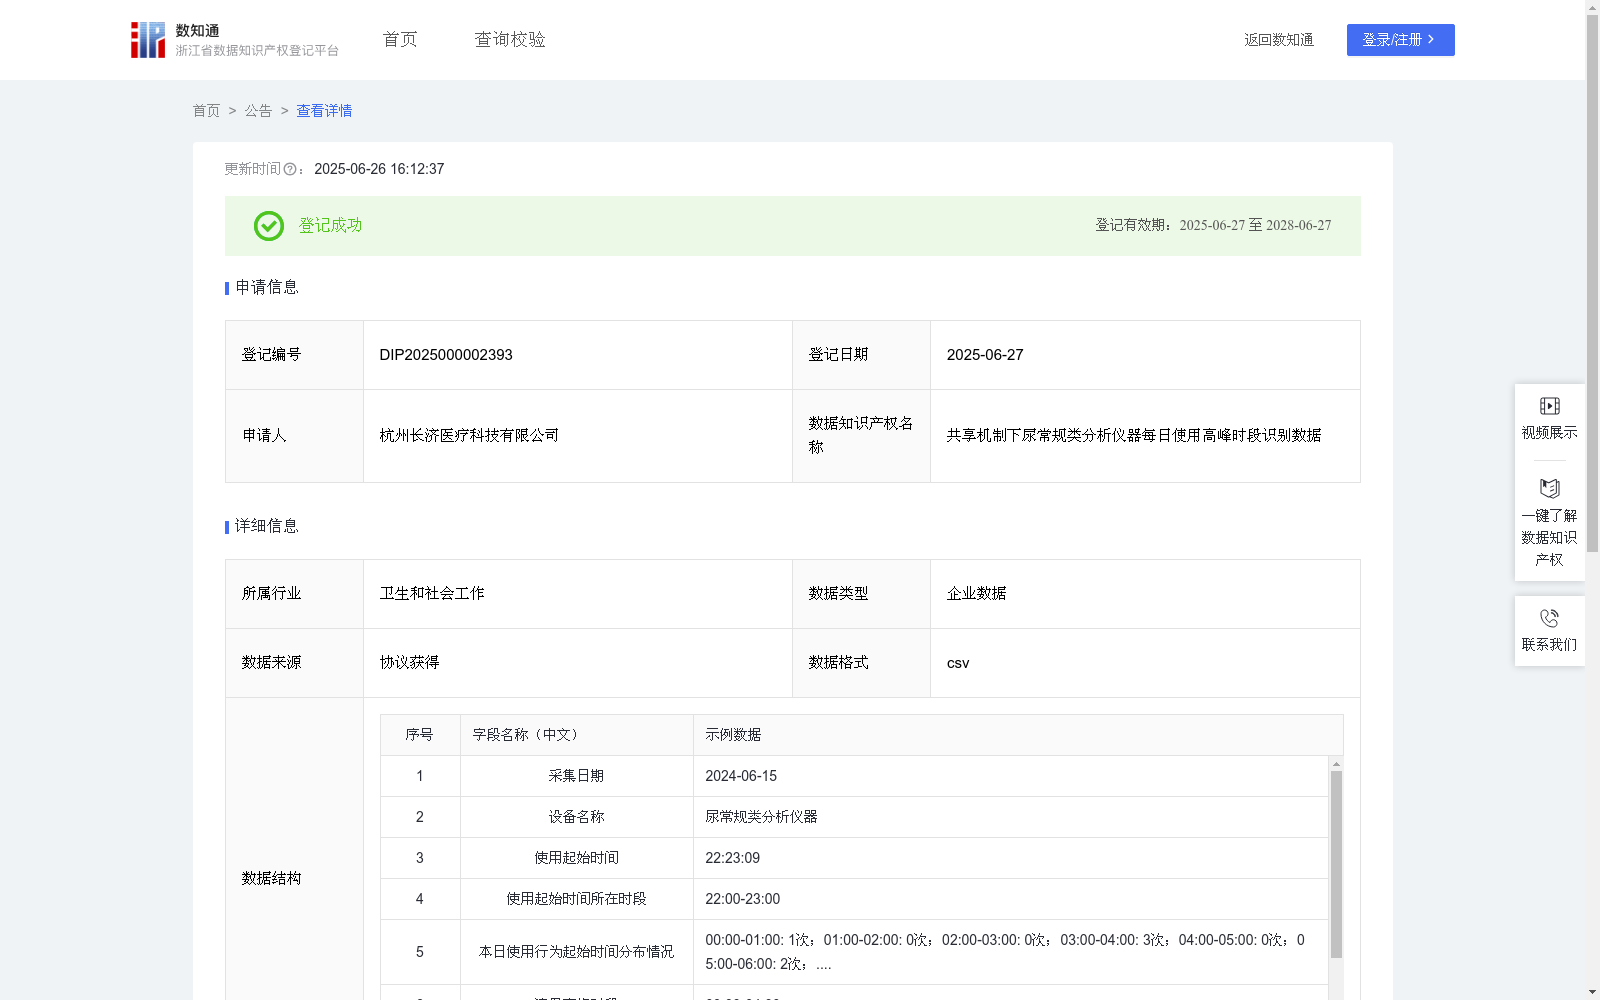
共享机制下尿常规类分析仪器每日使用高峰时段识别数据
收藏浙江省数据知识产权登记平台2025-06-26 更新2025-06-27 收录
下载链接:
https://www.zjip.org.cn/home/announce/trends/142400
下载链接
链接失效反馈官方服务:
资源简介:
本数据是对共享机制下尿常规类分析仪器每日每次使用的起始时间按小时进行聚合和分析,从而得到高峰时段数据。首先,本数据能够记录仪器所有时段的运行次数与时间,能有效地为仪器的智能待机等行为提供切实有效的数据支撑,从而更好地实现降低能耗与成本的目的。其次,本数据还能够为仪器使用者提供更好的服务体验。通过了解设备的高峰使用时段,使用者可以选择最佳的时间窗口(即非高峰时段)进行使用,避免长时间等待或设备不可用的情况。此外,这些数据还可以帮助仪器管理机构更好地规划人力资源和维护计划,确保在高需求时段有足够的技术人员和维护措施,以保障设备的稳定运行和用户的良好体验。1.数据收集和预处理:(1)数据收集:通过门诊助手app收集共享机制下尿常规类分析仪器的使用记录。具体包括采集日期、设备名称、使用起始时间等数据字段。(2)数据预处理:对采集到的原始数据进行处理,去除缺失和异常数据。
2.定义时间段:从0:00至24:00,以1时为间隔,一共划分为24个时间段。
3.对每日实时发生的使用起始时间进行归类和计数统计:运用Python中Pandas库的resample法,对每日所有该仪器的使用起始时间进行重采样和分组统计,具体过程为:①将每日实时发生的使用起始时间转换为Pandas的Datetime格式;②创建一个DataFrame,将起始时间数据组织成表格形式;③设置时间为索引;④使用resample方法按时重采样,输出起始时间所在时段,并计数每个时间段的事件数,得到本日所有仪器使用起始时间分布情况。
4.高峰时段识别:基于T,使用matplotlib库绘制时间-频次曲线图;利用基于尖锐度的自动识别方法,计算曲线图中各数据点的尖锐度,识别出凌晨24点-6点、上午6点-12点、下午12点-18点和晚上18点-24点的高峰时段。
This dataset aggregates and analyzes the start times of each daily use of urine routine analyzers under the shared mechanism by hour, to derive peak hour data. First, this dataset can record the operation times and timestamps of the instrument across all periods, effectively providing solid data support for intelligent standby and other behaviors of the instrument, thereby better achieving the goal of reducing energy consumption and costs. Second, it can also improve the service experience for instrument users. By understanding the peak usage periods of the equipment, users can select optimal time windows (i.e., off-peak periods) for use, avoiding long waits or situations where the device is unavailable. In addition, this data can help instrument management agencies better plan human resources and maintenance plans, ensuring that there are sufficient technical personnel and maintenance measures during high-demand periods to guarantee stable operation of the equipment and a good user experience.
1. Data Collection and Preprocessing:
(1) Data Collection: Collect usage records of urine routine analyzers under the shared mechanism via the Outpatient Assistant App. Specific data fields include collection date, device name, usage start time, etc.
(2) Data Preprocessing: Process the collected raw data by removing missing and abnormal data.
2. Time Period Definition: Divide the 24-hour period from 0:00 to 24:00 into 24 time intervals with a 1-hour interval.
3. Classification and Counting Statistics of Daily Real-time Usage Start Times: Use the resample method of the Pandas library in Python to resample and perform grouped statistics on the daily usage start times of the instrument. The specific process is as follows:
① Convert the daily real-time usage start times into Pandas Datetime format;
② Create a DataFrame and organize the start time data into a tabular form;
③ Set the time as the index;
④ Use the resample method to perform time-based resampling, output the time interval where the start time is located, and count the number of events in each time interval to obtain the distribution of the instrument's daily usage start times.
4. Peak Period Identification: Draw a time-frequency curve plot using the matplotlib library based on T; use a sharpness-based automatic recognition method to calculate the sharpness of each data point in the curve, and identify the peak periods from 24:00 to 6:00, 6:00 to 12:00 in the morning, 12:00 to 18:00 in the afternoon, and 18:00 to 24:00 in the evening.
提供机构:
杭州长济医疗科技有限公司
创建时间:
2025-04-11
搜集汇总
数据集介绍
背景与挑战
背景概述
该数据集记录了共享机制下尿常规类分析仪器每日使用的高峰时段,数据格式为csv,包含509条记录,每日更新。通过分析仪器使用起始时间的分布情况,识别出凌晨、上午、下午和晚上的高峰时段,旨在优化仪器使用效率、降低能耗成本,并提升用户体验。
以上内容由遇见数据集搜集并总结生成


