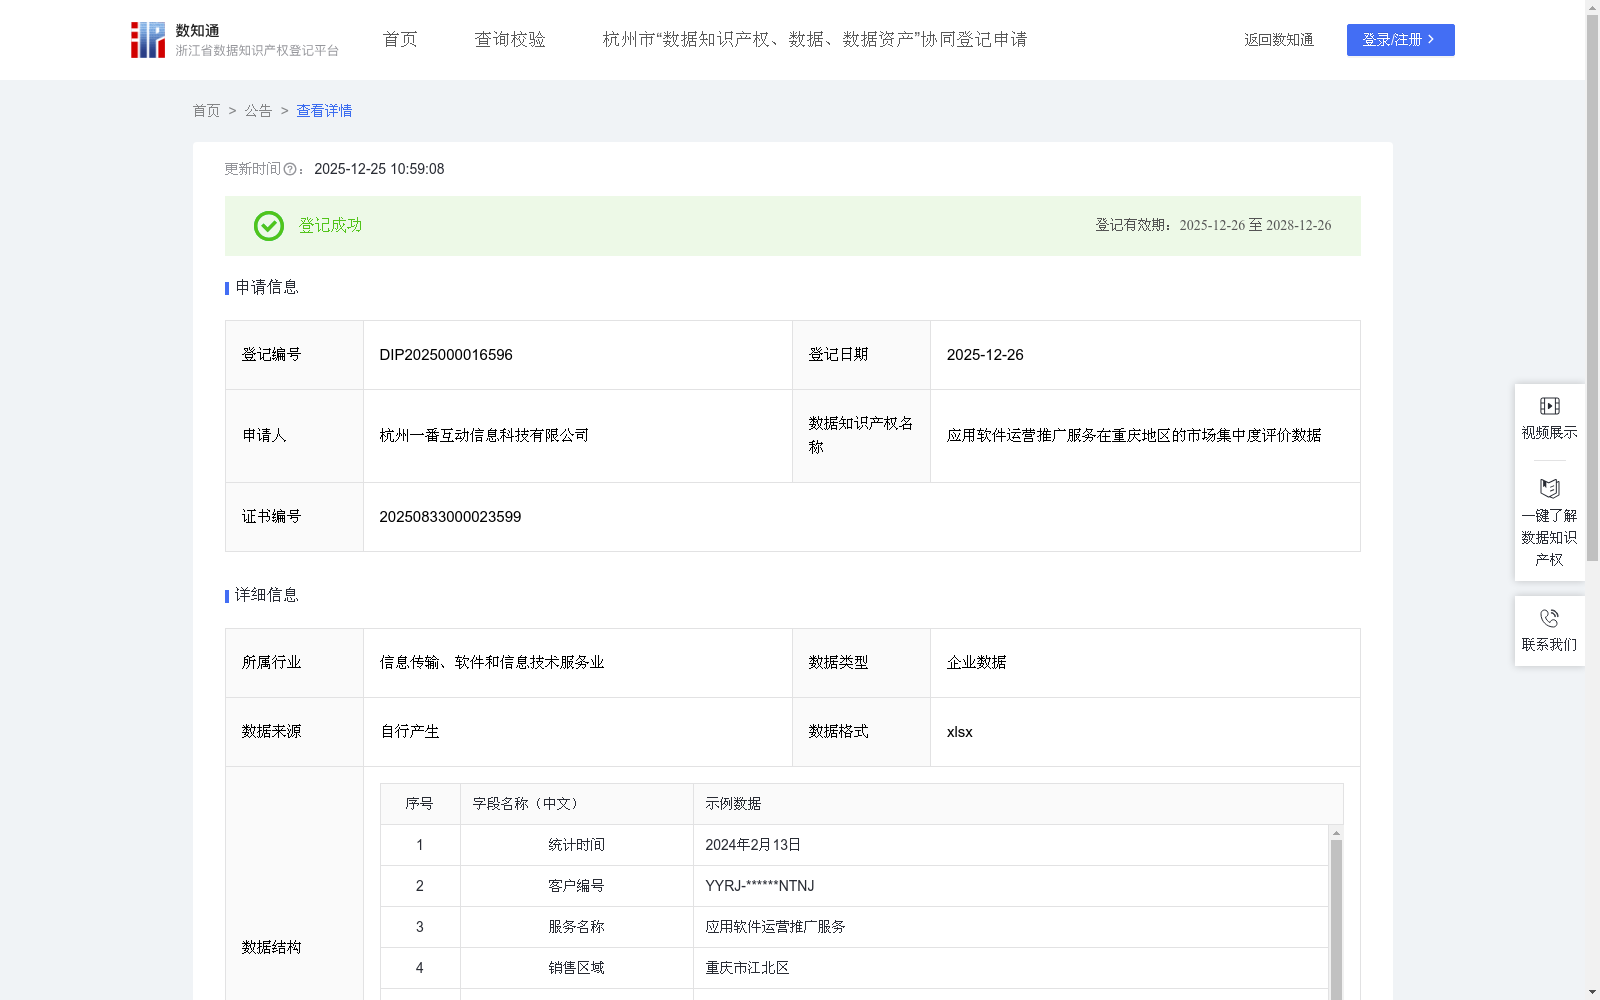
应用软件运营推广服务在重庆地区的市场集中度评价数据
收藏浙江省数据知识产权登记平台2025-12-25 更新2025-12-26 收录
下载链接:
https://www.zjip.org.cn/home/announce/trends/8418568
下载链接
链接失效反馈官方服务:
资源简介:
一、本公司可依据CR指数判断重庆地区应用软件运营推广服务市场的竞争格局,若集中度高则调整市场进入策略,若集中度低则加大资源投入抢占份额。
二、同行企业可参考该数据评估自身在重庆市场的相对位置,结合CR分类结果制定差异化竞争策略或区域合作计划,避免盲目扩张或资源浪费。
三、地方政府部门可利用该数据掌握本地数字服务行业的市场结构,识别是否存在垄断风险或市场活力不足问题,为制定产业扶持或反垄断政策提供依据。
四、行业协会可将该数据作为行业运行监测指标,定期发布市场集中度报告,引导会员单位合理布局业务,促进行业健康有序发展。
五、研究机构或高校可基于该数据开展区域数字经济生态研究,分析市场集中度与创新效率、服务质量之间的关系,为学术研究和公共决策提供实证支撑。1.数据采集:收集应用软件运营推广服务重庆地区的销售额数据,具体包括:统计时间、客户编号、服务名称、销售区域、销售额、总销售额。
2.数据处理:去除异常值和重复数据,确保数据的准确性和可靠性。将各区域的销售额数据转换为市场份额(Si),即各区域销售额占总市场销售额的比例。
3.具体计算过程和公式:市场份额计算:Si = 客户销售额 / 总销售额,市场集中度指数(CR)计算:CR = ∑(Si)^2,其中Si代表第i个客户的市场份额(销售额占总销售额的比例)。 4.数据分类分级应用:根据CR指数的大小,CR指数的取值范围为0到1,将市场集中度分为高集中度(0.7≤CR≤1)、中集中度(0.4≤CR<0.7)和低集中度(0≤CR<0.4)。
I. This company can judge the competitive landscape of the application software operation and promotion service market in Chongqing based on the Concentration Ratio (CR) index. Adjust market entry strategies when the market concentration is high, and increase resource investment to seize market share when the concentration is low.
II. Peer enterprises can refer to this dataset to assess their relative position in the Chongqing market, formulate differentiated competitive strategies or regional cooperation plans based on the CR classification results, and avoid blind expansion or resource waste.
III. Local government departments can use this dataset to understand the market structure of the local digital service industry, identify whether there are monopoly risks or insufficient market vitality, and provide a basis for formulating industrial support or anti-monopoly policies.
IV. Industry associations can use this dataset as an industry operation monitoring indicator, regularly release market concentration reports, guide member enterprises to rationally layout their businesses, and promote the healthy and orderly development of the industry.
V. Research institutions or universities can conduct regional digital economy ecosystem research based on this dataset, analyze the relationship between market concentration, innovation efficiency and service quality, and provide empirical support for academic research and public decision-making.
1. Data Collection: Collect sales data of application software operation and promotion services in Chongqing, specifically including: statistical time, customer ID, service name, sales region, sales amount, and total market sales amount.
2. Data Processing: Remove outliers and duplicate data to ensure the accuracy and reliability of the dataset. Convert the sales data of each region into market share ($S_i$), which refers to the proportion of a region's sales amount in the total market sales amount.
3. Specific Calculation Process and Formula:
- Market share calculation: $S_i = frac{ ext{Customer Sales Amount}}{ ext{Total Market Sales Amount}}$
- Market Concentration Ratio (CR) calculation: $CR = sum_{i=1}^{n} (S_i)^2$, where $S_i$ represents the market share of the i-th customer (the proportion of its sales amount in the total market sales amount).
4. Data Classification and Grading Application: According to the value of the CR index, which ranges from 0 to 1, the market concentration is divided into three levels: high concentration ($0.7 leq CR leq 1$), medium concentration ($0.4 leq CR < 0.7$), and low concentration ($0 leq CR < 0.4$).
提供机构:
杭州一番互动信息科技有限公司
创建时间:
2025-08-20
搜集汇总
数据集介绍
背景与挑战
背景概述
该数据集旨在评估重庆地区应用软件运营推广服务的市场集中度,但当前提供的描述内容不完整,仅显示为平台名称的重复信息,无法获取具体的评价指标、数据范围或时间周期等细节。建议参考数据集名称以了解其基本主题方向。
以上内容由遇见数据集搜集并总结生成


