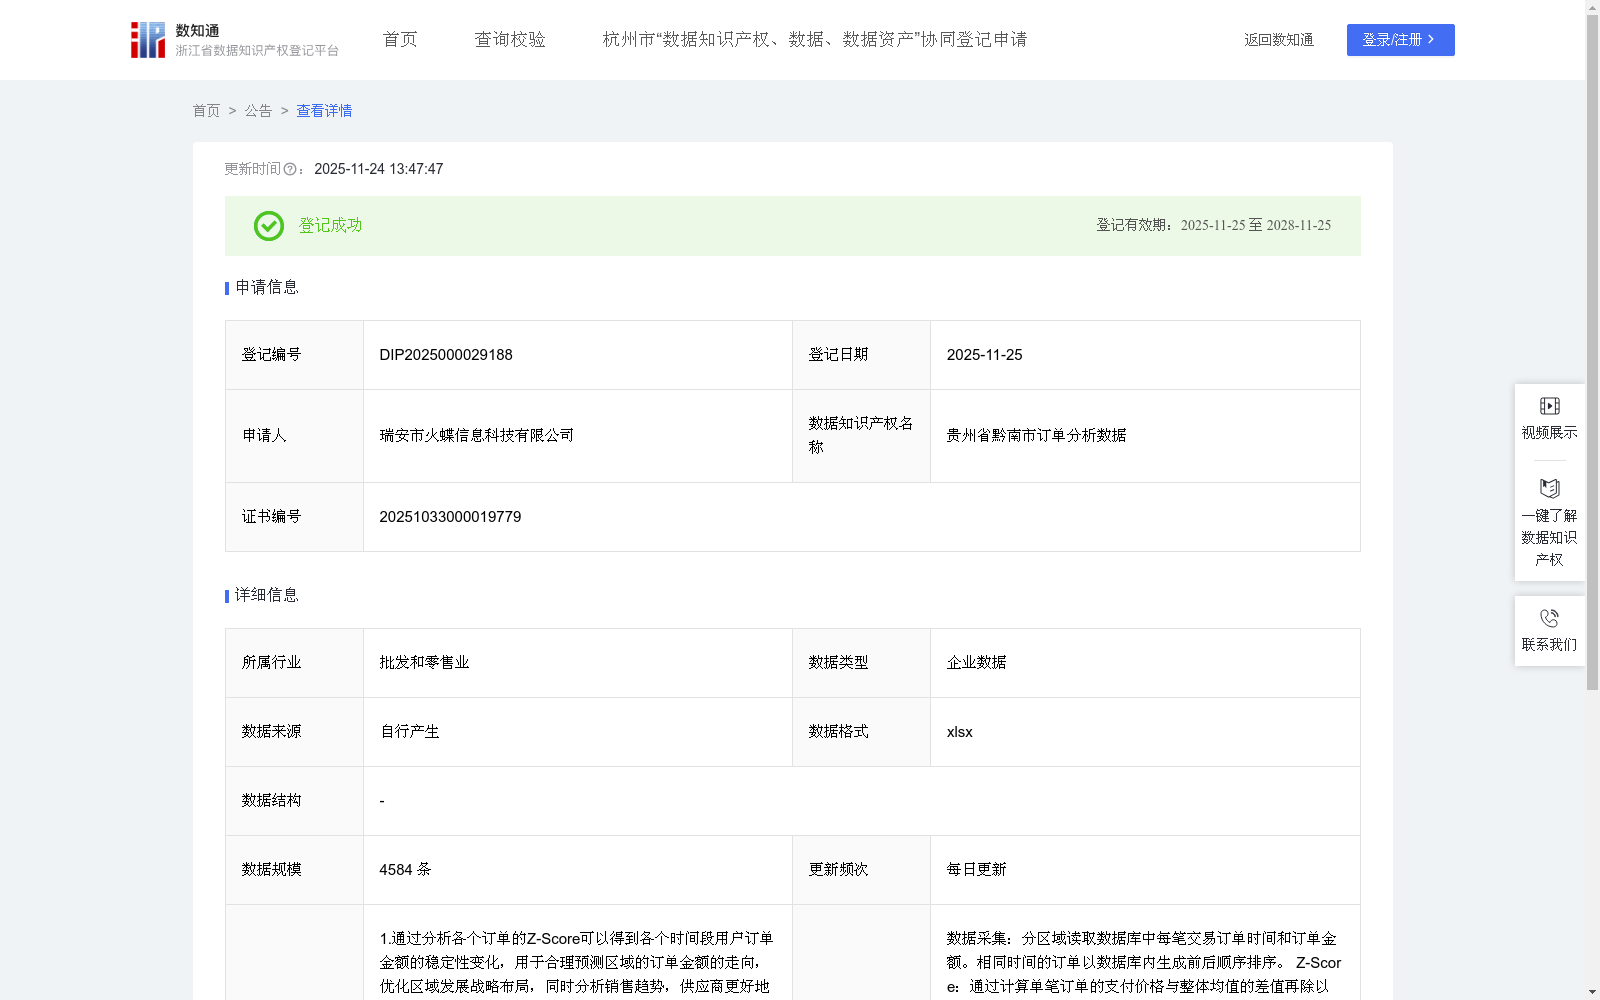
贵州省黔南市订单分析数据
收藏浙江省数据知识产权登记平台2025-11-24 更新2025-11-25 收录
下载链接:
https://www.zjip.org.cn/home/announce/trends/8404968
下载链接
链接失效反馈官方服务:
资源简介:
1.通过分析各个订单的Z-Score可以得到各个时间段用户订单金额的稳定性变化,用于合理预测区域的订单金额的走向,优化区域发展战略布局,同时分析销售趋势,供应商更好地安排生产计划和物流配送,提升供应链协同效率2.建立科学的战略决策模型。该模型能够识别高峰时间段,指导企业合理配置资源,通过环比增长数据可以分析得到各个时间段的峰值时间,指导企业科学应对销售高峰期,很好的进行科学排班,确保足够人手,控制人力成本。3.通过t(评分系统)和s(评分系统)的综合分析可以能够制定针对性的渠道优化方案和营销策略,向用户推送优惠信息,提升转化率,提升整体市场竞争力
数据采集:分区域读取数据库中每笔交易订单时间和订单金额。相同时间的订单以数据库内生成前后顺序排序。 Z-Score:通过计算单笔订单的支付价格与整体均值的差值再除以总体标准差得到Z-Score。环比增长:通过计算当前订单金额与前一笔订单的比值减1获得(当首行或者无前序数据返回空值)。t和 s为评分系统,当Z-Score>0.2时t为正不稳定,当0.2≥Z-Score≥-0.2时t为稳定,当Z-Score<-0.2时t为负不稳定。当环比增长>0则s=增大,当环比增长=0时 s=稳定,当s<0时s=减小。峰值区间说明:由于s是基于前一条订单做出的判断, 当前时间的s处于增加而后一条订单的s处于减少的时候则当前订单数据为区间内峰值。
1. Analyzing the Z-Score of individual orders enables the identification of variations in the stability of user order amounts across different time periods. This supports the reasonable prediction of regional order amount trends, optimization of regional development strategic layouts, and analysis of sales trends, allowing suppliers to better arrange production plans and logistics distribution, thereby enhancing supply chain collaboration efficiency.
2. Establish a scientific strategic decision-making model. This model can identify peak time periods and guide enterprises to rationally allocate resources. By analyzing sequential growth data, the peak time points of each time period can be obtained, which guides enterprises to scientifically respond to sales peak periods, carry out effective scientific scheduling, ensure sufficient staffing, and control labor costs.
3. Through comprehensive analysis of the t (scoring system) and s (scoring system), targeted channel optimization plans and marketing strategies can be formulated, promotional information can be pushed to users, conversion rate can be improved, and overall market competitiveness can be enhanced.
Data Collection: Read the order time and order amount of each transaction in the database by region. Orders occurring at the same time are sorted according to their generation sequence within the database.
Z-Score: The Z-Score is calculated by dividing the difference between the payment price of a single order and the overall population mean by the population standard deviation.
Sequential Growth: Obtained by calculating (the ratio of the current order amount to the preceding order amount) minus 1 (return a null value for the first row or when there is no preceding data).
Scoring System Rules:
t and s are both scoring systems:
- For the t scoring system: when Z-Score > 0.2, t indicates positive instability; when 0.2 ≥ Z-Score ≥ -0.2, t indicates stability; when Z-Score < -0.2, t indicates negative instability.
- For the s scoring system: when sequential growth > 0, s = "increasing"; when sequential growth = 0, s = "stable"; when sequential growth < 0, s = "decreasing".
Peak Interval Explanation: Since the s score is determined based on the preceding order, the current order data is identified as a peak within the interval when the s score of the current time period is increasing and the s score of the subsequent order is decreasing.
提供机构:
瑞安市火蝶信息科技有限公司
创建时间:
2025-10-28
搜集汇总
数据集介绍
背景与挑战
背景概述
该数据集包含4584条贵州省黔南市企业订单数据,每日更新,通过Z-Score和环比增长等算法分析订单金额稳定性与销售趋势,主要应用于供应链优化、资源调配和营销策略制定等商业决策场景。
以上内容由遇见数据集搜集并总结生成


