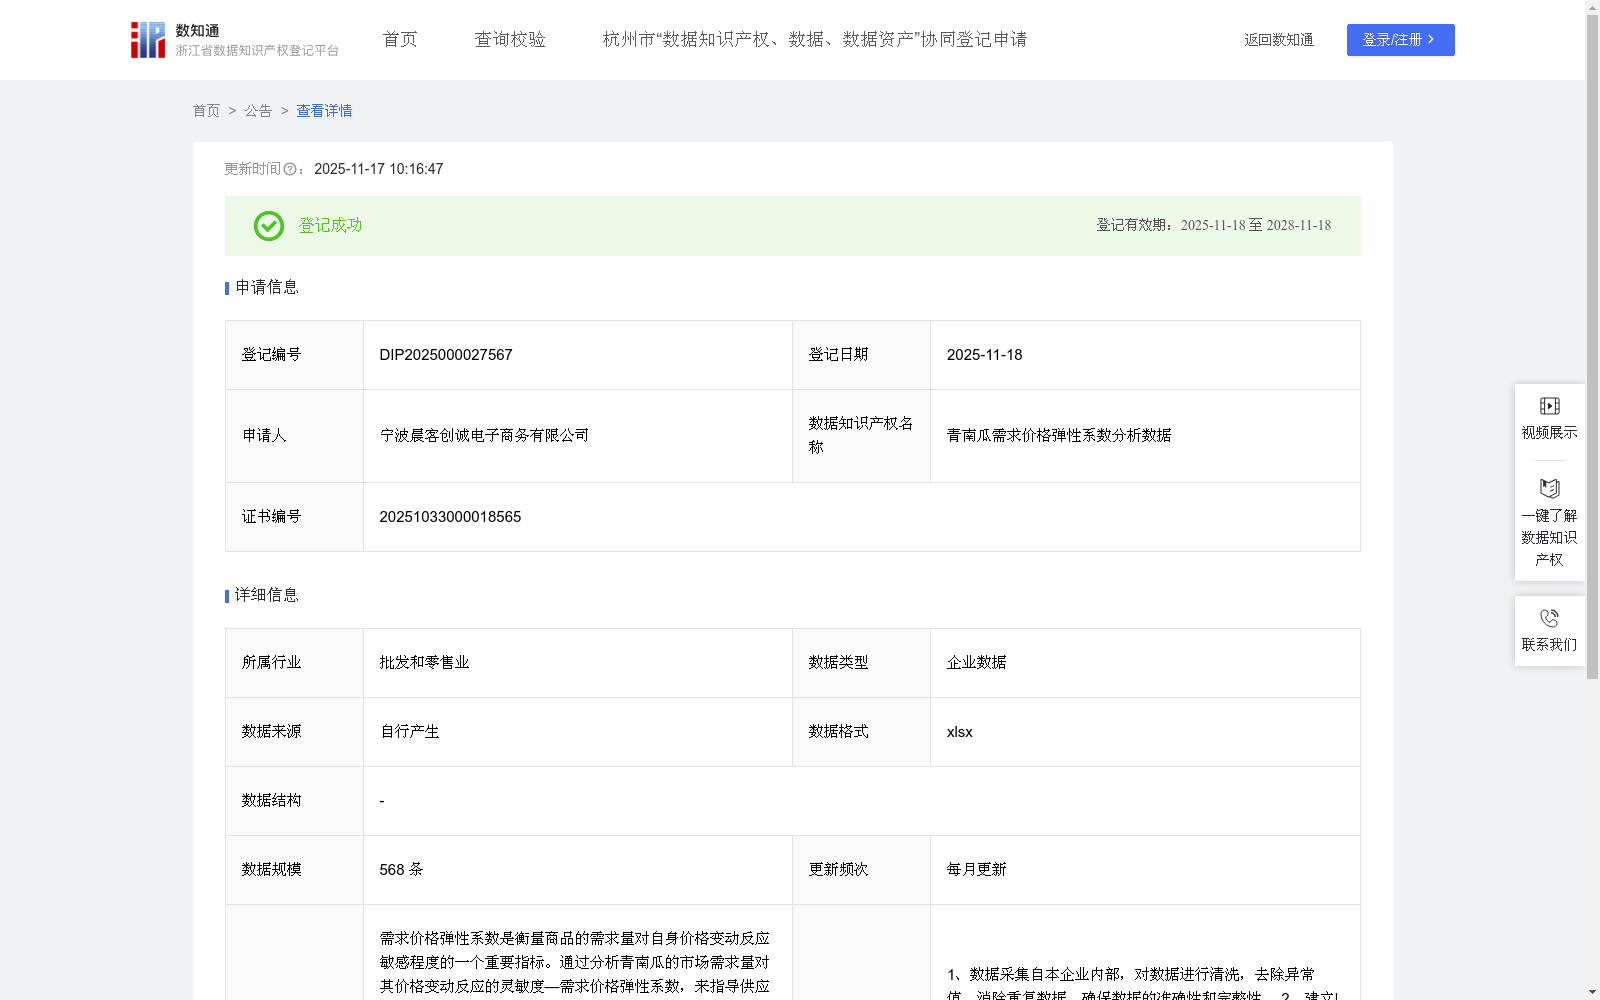
青南瓜需求价格弹性系数分析数据
收藏浙江省数据知识产权登记平台2025-11-17 更新2025-11-18 收录
下载链接:
https://www.zjip.org.cn/home/announce/trends/8400150
下载链接
链接失效反馈官方服务:
资源简介:
需求价格弹性系数是衡量商品的需求量对自身价格变动反应敏感程度的一个重要指标。通过分析青南瓜的市场需求量对其价格变动反应的灵敏度—需求价格弹性系数,来指导供应链上下游企业实现精准定价、制定适配的运营决策与全链路管理。(1)可以帮助供应链上下游企业合理调整商品库存,有效降低库存成本。提高资金周转效率。 (2)上游企业可据此进行顺应市场的价格调节,巩固现有市场份额,提高产品竞争能力。(3)帮助企业针对不同弹性商品制定不同的促销方案。如:弹性大的商品用大力度价格降价的促销方式冲销量、提收益,弹性小的商品通过附加赠品等方式增加消费。为供应链上下游企业制定个性化营销策略提供有力的数据支持。1、数据采集自本企业内部,对数据进行清洗,去除异常值、消除重复数据,确保数据的准确性和完整性。
2、建立|Ed|需求价格弹性系数模型:|Ed| =|[(Q2 - Q1)/((Q1 + Q2)/2)] / [(P2 - P1)/((P1 + P2)/2)]|。|Ed|为需求价格弹性系数(绝对值,小数点后取两位),P1为上月配送均价(元/斤);P2为本月配送均价(元/斤);Q1为上月配送数量(斤);Q2 为本月配送数量(斤),配送均价采自企业销售月报表。
3、|Ed|反映了数量变动对于价格变动的反应程度,即价格上升或下降时,需求数量的变化情况。
The price elasticity of demand coefficient is an important indicator measuring the sensitivity of a commodity’s demand quantity to changes in its own price. By analyzing the sensitivity of the market demand for green pumpkins to price changes—i.e., the price elasticity of demand coefficient—we can guide upstream and downstream enterprises in the supply chain to achieve precise pricing, formulate appropriate operational decisions, and implement end-to-end supply chain management.
(1) It can help upstream and downstream supply chain enterprises reasonably adjust commodity inventory, effectively reduce inventory costs, and improve capital turnover efficiency.
(2) Upstream enterprises can conduct market-aligned price adjustments based on this indicator, consolidate their existing market share, and enhance product competitiveness.
(3) It helps enterprises formulate different promotional plans for commodities with varying elasticities. For example: for commodities with high elasticity, use deep price cut promotions to boost sales volume and increase revenue; for commodities with low elasticity, stimulate consumption through methods such as adding free gifts. This provides solid data support for upstream and downstream supply chain enterprises to develop personalized marketing strategies.
1. Data is collected from within the enterprise, and data cleaning is performed to remove outliers and duplicate entries, ensuring the accuracy and completeness of the data.
2. Establish the |Ed| price elasticity of demand coefficient model: |Ed| = |[ (Q2 - Q1) / ((Q1 + Q2)/2) ] / [ (P2 - P1) / ((P1 + P2)/2) ]|. |Ed| represents the price elasticity of demand coefficient (absolute value, rounded to two decimal places); P1 is the average delivery price of the previous month (yuan/jin); P2 is the average delivery price of the current month (yuan/jin); Q1 is the delivery quantity of the previous month (jin); Q2 is the delivery quantity of the current month (jin). The average delivery price is sourced from the enterprise’s monthly sales reports.
3. |Ed| reflects the degree of response of quantity changes to price changes, i.e., the changes in demand quantity when prices rise or fall.
提供机构:
宁波晨客创诚电子商务有限公司
创建时间:
2025-10-20
搜集汇总
数据集介绍
背景与挑战
背景概述
该数据集是宁波晨客创诚电子商务有限公司登记的青南瓜需求价格弹性系数分析数据,包含568条企业数据,每月更新,格式为xlsx。它通过计算需求价格弹性系数(|Ed|)来衡量青南瓜需求量对价格变动的敏感度,帮助供应链企业优化定价、库存和营销策略,提升运营效率。
以上内容由遇见数据集搜集并总结生成


