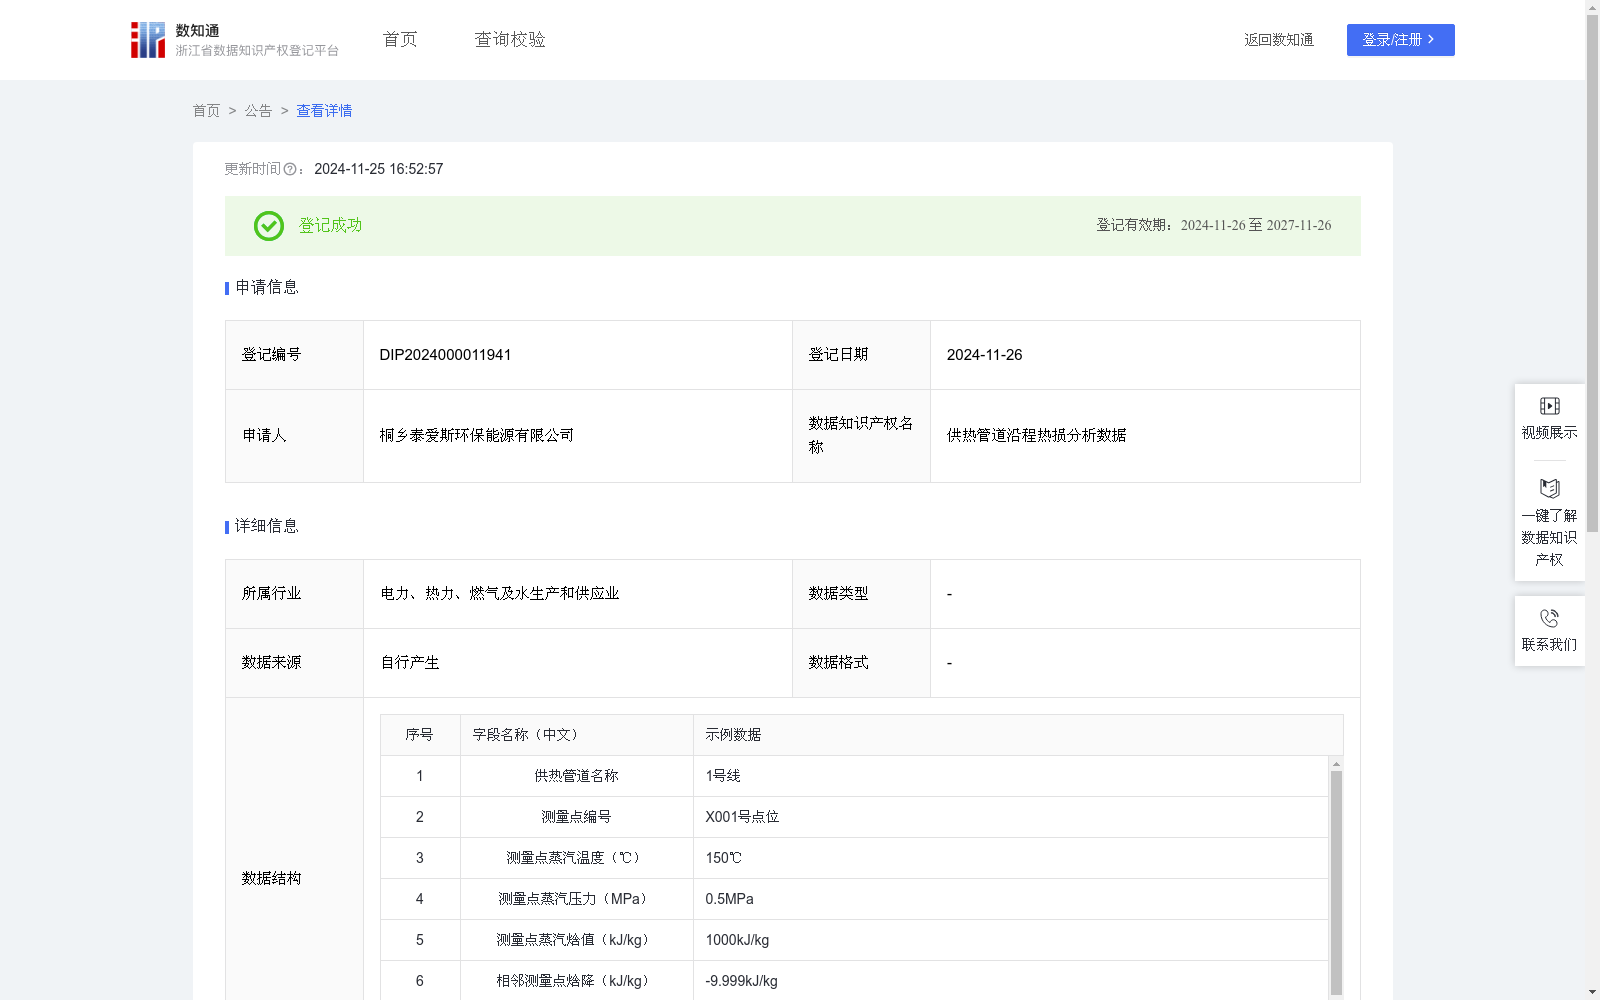
供热管道沿程热损分析数据
收藏浙江省数据知识产权登记平台2024-11-25 更新2024-11-26 收录
下载链接:
https://www.zjip.org.cn/home/announce/trends/89035
下载链接
链接失效反馈官方服务:
资源简介:
通过采集各管网各测量点的蒸汽温度、压力,并得到对应测量点的蒸汽焓值,对比相邻测量点焓降与平均相邻测量点焓降,分析局部管损情况,进而指导判断是否需要检修等情况,指导智慧热网管道供热,调整蒸汽流量、优化设备运行参数等,以降低生产效率下降和能源浪费的风险,从而减少损失。为热电企业新建供热项目的可行性研究提供数据支持,可以通过分析热损数据和预期的供热负荷,可以评估新建供热项目的经济效益和环境效益,为决策提供依据。政府部门也可以利用供热管道沿程热损分析数据制定相关的能源政策和环保政策。使用决策树模型:1、采集测量点蒸汽温度、测量点蒸汽压力、测量点蒸汽焓值、相邻测量点焓降、平均相邻测量点焓降等特征,以及设备故障损失指标。2、相邻测量点焓降为相邻两个测量点间的蒸汽焓值下降数值;平均相邻测量点焓降=average(相邻测量点焓降),平均相邻测量点焓降为同一热网管线相邻测量点焓降的距离加权平均值。3、对数据进行预处理,去除异常值和缺失值,并进行标准化处理。4、分析各个特征与损失指标之间的相关性,发现相邻测量点焓降和平均相邻测量点焓降与设备故障损失之间有较强的相关性。5、选择相邻测量点焓降和平均相邻测量点焓降作为决策树的输入特征,将设备故障损失程度作为决策树的目标变量。6、使用信息增益准则构建决策树,从根节点开始,根据相邻测量点焓降和平均相邻测量点焓降的取值将数据样本划分到不同的子节点中。7、对决策树进行剪枝,提高其泛化能力。8、使用测试数据对决策树进行评估,发现其能够准确地预测生产效率下降、设备故障损失程度的情况。9、根据决策树的预测结果,当相邻测量点焓降和平均相邻测量点焓降超过一定阈值时,出现异常,设备故障,采取相应的措施,及时调整各个参数,增强供热管道运行稳定性。
By collecting the steam temperature and pressure at each measurement point of the pipe network, and obtaining the steam enthalpy at the corresponding measurement points, the enthalpy drop between adjacent measurement points and the average enthalpy drop between adjacent measurement points are compared to analyze local pipe heat loss, so as to guide the judgment of whether maintenance is needed, support the operation of intelligent heating network pipelines, adjust steam flow, optimize equipment operating parameters, etc., thereby reducing the risks of reduced production efficiency and energy waste, and thus minimizing losses.
This dataset provides data support for the feasibility study of new heating projects for thermal power enterprises. By analyzing heat loss data and expected heating loads, the economic and environmental benefits of new heating projects can be evaluated, providing a basis for decision-making. Government departments can also use the analysis data of along-pipeline heat loss of heating pipes to formulate relevant energy policies and environmental protection policies.
The decision tree model is applied as follows:
1. Collect features including steam temperature at measurement points, steam pressure at measurement points, steam enthalpy at measurement points, enthalpy drop between adjacent measurement points, average enthalpy drop between adjacent measurement points, as well as equipment fault loss indicators.
2. The enthalpy drop between adjacent measurement points refers to the decrease in steam enthalpy between two adjacent measurement points; the average enthalpy drop between adjacent measurement points is the distance-weighted average of the enthalpy drops of adjacent measurement points on the same heating network pipeline, calculated as average(enthalpy drop between adjacent measurement points).
3. Preprocess the data by removing outliers and missing values, and perform standardization processing.
4. Analyze the correlation between each feature and the loss indicator, and find that the enthalpy drop between adjacent measurement points and the average enthalpy drop between adjacent measurement points have a strong correlation with equipment fault loss.
5. Select the enthalpy drop between adjacent measurement points and the average enthalpy drop between adjacent measurement points as the input features of the decision tree, and take the severity of equipment fault loss as the target variable of the decision tree.
6. Construct the decision tree using the information gain criterion, starting from the root node, and divide the data samples into different child nodes based on the values of the enthalpy drop between adjacent measurement points and the average enthalpy drop between adjacent measurement points.
7. Prune the decision tree to improve its generalization ability.
8. Evaluate the decision tree using test data, and find that it can accurately predict the situations of reduced production efficiency and the severity of equipment fault loss.
9. According to the prediction results of the decision tree, when the enthalpy drop between adjacent measurement points and the average enthalpy drop between adjacent measurement points exceed a certain threshold, anomalies and equipment faults will occur. Take corresponding measures, adjust various parameters in time, and enhance the operational stability of the heating pipeline.
提供机构:
桐乡泰爱斯环保能源有限公司
创建时间:
2024-10-18
搜集汇总
数据集介绍
特点
该数据集记录了供热管道的沿程热损分析数据,包含510条记录,每月更新。数据通过决策树模型分析,用于预测设备故障和优化供热管道运行,适用于热电企业的供热项目可行性研究和政府部门的能源政策制定。
以上内容由遇见数据集搜集并总结生成


