基于卫星观测地表温度的全球热浪空间特征数据集(2016-2020)
收藏资源简介:
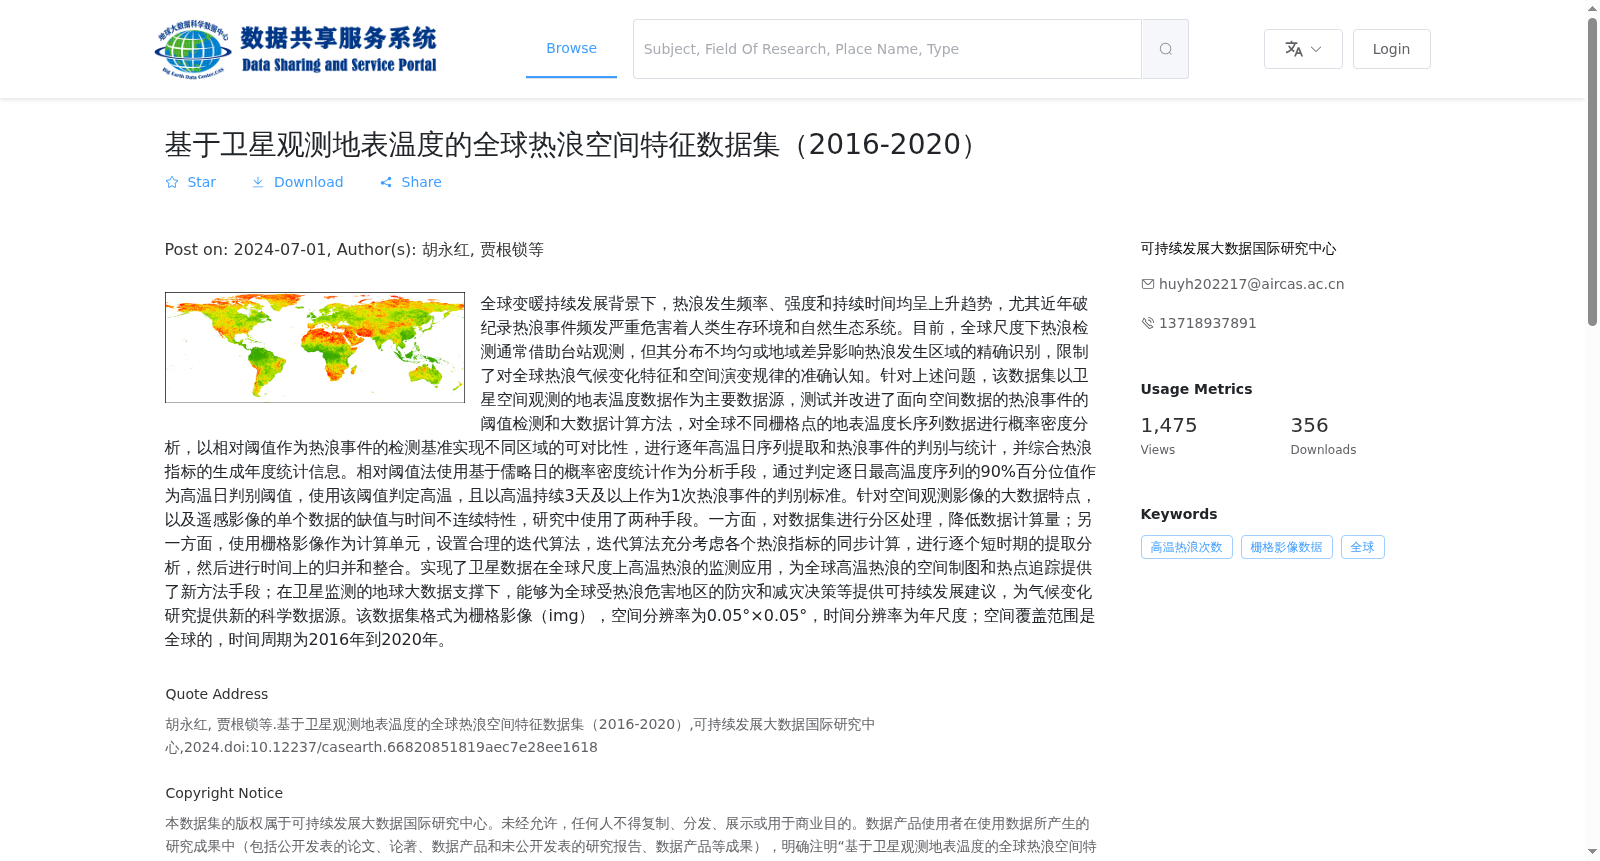
全球变暖持续发展背景下,热浪发生频率、强度和持续时间均呈上升趋势,尤其近年破纪录热浪事件频发严重危害着人类生存环境和自然生态系统。目前,全球尺度下热浪检测通常借助台站观测,但其分布不均匀或地域差异影响热浪发生区域的精确识别,限制了对全球热浪气候变化特征和空间演变规律的准确认知。针对上述问题,该数据集以卫星空间观测的地表温度数据作为主要数据源,测试并改进了面向空间数据的热浪事件的阈值检测和大数据计算方法,对全球不同栅格点的地表温度长序列数据进行概率密度分析,以相对阈值作为热浪事件的检测基准实现不同区域的可对比性,进行逐年高温日序列提取和热浪事件的判别与统计,并综合热浪指标的生成年度统计信息。相对阈值法使用基于儒略日的概率密度统计作为分析手段,通过判定逐日最高温度序列的90%百分位值作为高温日判别阈值,使用该阈值判定高温,且以高温持续3天及以上作为1次热浪事件的判别标准。针对空间观测影像的大数据特点,以及遥感影像的单个数据的缺值与时间不连续特性,研究中使用了两种手段。一方面,对数据集进行分区处理,降低数据计算量;另一方面,使用栅格影像作为计算单元,设置合理的迭代算法,迭代算法充分考虑各个热浪指标的同步计算,进行逐个短时期的提取分析,然后进行时间上的归并和整合。实现了卫星数据在全球尺度上高温热浪的监测应用,为全球高温热浪的空间制图和热点追踪提供了新方法手段;在卫星监测的地球大数据支撑下,能够为全球受热浪危害地区的防灾和减灾决策等提供可持续发展建议,为气候变化研究提供新的科学数据源。该数据集格式为栅格影像(img),空间分辨率为0.05°×0.05°,时间分辨率为年尺度;空间覆盖范围是全球的,时间周期为2016年到2020年。
Against the backdrop of ongoing global warming, the frequency, intensity, and duration of heatwaves have been on the rise. Particularly in recent years, the frequent occurrence of record-breaking heatwaves has severely harmed human living environments and natural ecosystems. Currently, global-scale heatwave detection mostly relies on in-situ station observations. However, the uneven distribution of stations and regional differences impede the accurate identification of heatwave occurrence areas, limiting the precise understanding of climate change characteristics and spatial evolution patterns of global heatwaves. To address these issues, this dataset uses satellite-observed land surface temperature (LST) data as its primary data source. It tests and improves threshold-based detection and big data computing methods for spatial data-oriented heatwave events. Specifically, it conducts probability density analysis on long-term LST time series data across global grid cells. Taking relative thresholds as the detection benchmark for heatwave events ensures comparability across different regions. The dataset extracts annual high-temperature day sequences, discriminates and counts heatwave events, and compiles annual statistical information for heatwave metrics. The relative threshold method uses probability density statistics based on Julian days as the analytical approach. It takes the 90th percentile value of the daily maximum temperature time series as the discrimination threshold for high-temperature days. High temperatures are identified using this threshold, and a heatwave event is defined as a period of high temperatures lasting 3 consecutive days or more. In view of the big data characteristics of spatial observation imagery, as well as the missing values and temporal discontinuity of individual remote sensing image data, two measures are adopted in this study. On one hand, the dataset is partitioned to reduce computational load. On the other hand, grid imagery is used as the computing unit, with a reasonable iterative algorithm designed. The iterative algorithm fully considers the synchronous calculation of various heatwave metrics, extracts and analyzes short-term segments one by one, and then merges and integrates them temporally. This enables the application of satellite data for global-scale high-temperature and heatwave monitoring, providing new methods and tools for global spatial mapping and hotspot tracking of heatwaves. Supported by Earth big data from satellite monitoring, it can provide sustainable development recommendations for disaster prevention and mitigation decision-making in regions affected by heatwaves worldwide, and offer new scientific data sources for climate change research. The dataset is stored in grid imagery (img) format, with a spatial resolution of 0.05° × 0.05° and a temporal resolution of annual scale. It covers the entire globe, with a temporal span from 2016 to 2020.