青藏高原地域功能类型与区划基础数据汇集(2020)
收藏国家青藏高原科学数据中心2025-06-19 更新2025-06-14 收录
下载链接:
https://data.tpdc.ac.cn/zh-hans/data/e4521454-509c-4123-b784-a74281a7c7d0
下载链接
链接失效反馈官方服务:
资源简介:
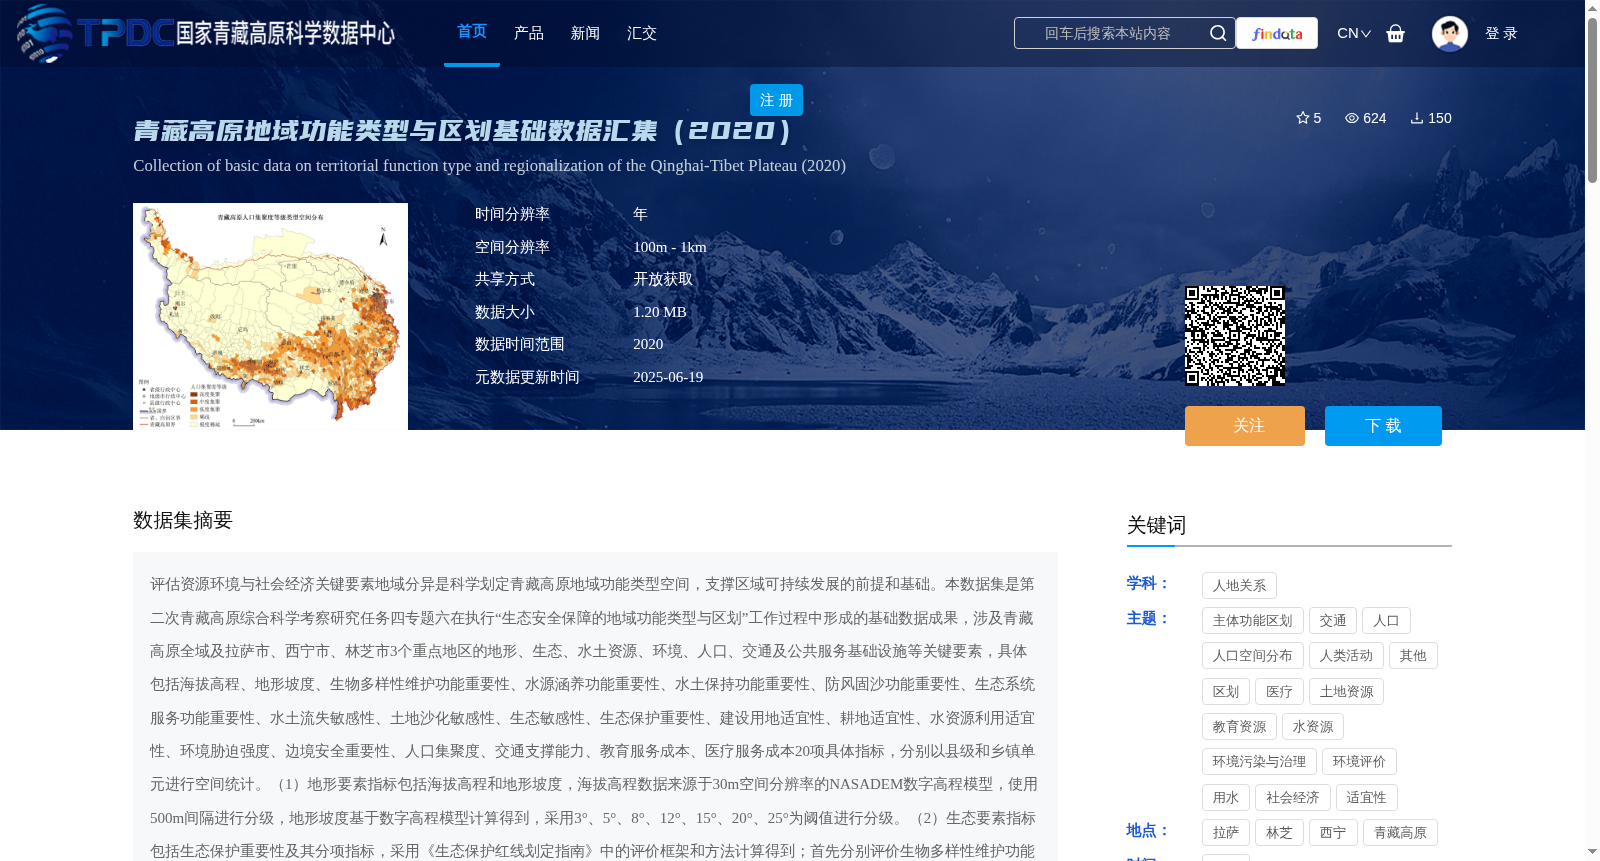
评估资源环境与社会经济关键要素地域分异是科学划定青藏高原地域功能类型空间,支撑区域可持续发展的前提和基础。本数据集是第二次青藏高原综合科学考察研究任务四专题六在执行“生态安全保障的地域功能类型与区划”工作过程中形成的基础数据成果,涉及青藏高原全域及拉萨市、西宁市、林芝市3个重点地区的地形、生态、水土资源、环境、人口、交通及公共服务基础设施等关键要素,具体包括海拔高程、地形坡度、生物多样性维护功能重要性、水源涵养功能重要性、水土保持功能重要性、防风固沙功能重要性、生态系统服务功能重要性、水土流失敏感性、土地沙化敏感性、生态敏感性、生态保护重要性、建设用地适宜性、耕地适宜性、水资源利用适宜性、环境胁迫强度、边境安全重要性、人口集聚度、交通支撑能力、教育服务成本、医疗服务成本20项具体指标,分别以县级和乡镇单元进行空间统计。(1)地形要素指标包括海拔高程和地形坡度,海拔高程数据来源于30m空间分辨率的NASADEM数字高程模型,使用500m间隔进行分级,地形坡度基于数字高程模型计算得到,采用3°、5°、8°、12°、15°、20°、25°为阈值进行分级。(2)生态要素指标包括生态保护重要性及其分项指标,采用《生态保护红线划定指南》中的评价框架和方法计算得到;首先分别评价生物多样性维护功能重要性、水源涵养功能重要性、水土保持功能重要性、防风固沙功能重要性、水土流失敏感性、土地沙化敏感性6项基础指标,采用最大值法叠加得到生态系统服务功能重要性和生态敏感性,在此基础上集成得到生态保护重要性,所有指标划分为低、较低、一般、较高和高5个等级。(3)水土资源要素指标包括建设用地适宜性、耕地适宜性和水资源利用适宜性:建设用地适宜性由空气密度参数和坡地适建系数两个指标的乘积表示,耕地适宜性由气温参数和土壤抗蚀系数两个指标的乘积表示,指标参数分别反映了随海拔变化的空气含氧量和温度,以及不同地形坡度下开展建设活动的难易程度和耕地的潜在土壤侵蚀风险,评价结果划分为不适宜、欠适宜、一般适宜、较适宜、适宜5个等级;水资源利用适宜性考虑了水资源可及性和降水支撑能力,其中水资源可及性是水源可靠性和供水成本的距离函数,降水支撑能力为多年平均降水量,评价结果划分为低、较低、一般、较高和高5个等级。(4)环境要素指标为环境胁迫强度,其是在环境污染源空间划分的基础上,通过测算固体废弃物、水体污染物和大气污染物排放强度综合集成得到,评价结果划分为低、较低、一般、较高和高5个等级。(5)边境安全重要性旨在通过对我国边境区域及与邻接国家关系的综合研判,将边境区域按安全程度划分为不同等级区,评价指标包括边境区域与边境线相对空间区位、邻国特征及与我国战略竞合关系、边境安全战略枢纽地位等,评价结果划分为极重要、较重要、一般重要3个等级。(6)人口要素指标为人口集聚度,由人口密度和人口流动强度两个指标构成,数据来源为2020年第七次人口普查分乡镇(街道)数据,评价结果划分为高度集聚区、中度集聚区、低度集聚区、稀疏区、极度稀疏区5个等级。(7)交通及公共服务基础设施指标包括交通支撑能力、教育服务成本和医疗服务成本:交通支撑能力通过整合实地科考记录的乡镇驻地数据与道路数据,采用ArcGIS软件中的成本距离工具生成成本栅格数据;医疗服务成本使用了一、二、三级医院的就医时间、人口加权就医时间及综合成本等指标,其中就医时间基于不同等级医院坐标与研究区成本栅格数据,利用ArcGIS的成本距离工具计算得到各栅格点至各级医院的最短时间成本,人口加权就医时间通过OSM路网拟合成本栅格计算得出,综合成本融合了人口加权就医时间、人均卫生技术人员数和人均医疗经费投入三个指标,结合熵权法确定的指标权重集成得到综合成本值;教育服务成本使用了小学就学时间、人口加权就学时间及综合成本等指标,其中小学就学时间基于小学坐标与研究区成本栅格数据,利用ArcGIS的成本距离工具计算得到各栅格点至小学的最短时间成本,人口加权就学时间基于道路拟合得到成本栅格,综合成本综合了人口加权就学时间、生均教师数和生均教育经费投入三个指标,结合熵权法确定的指标权重集成得到综合成本值;交通及公共服务基础设施指标涉及到的路网数据来自于OpenStreetMap平台,医院名录、卫生技术人员数和医疗经费投入来自于各省(区)卫生健康委,小学名录、教师数量和教育经费投入数据来源于各省(区)教育部门,时间节点为2020年。
Evaluating the regional differentiation of key factors of resources, environment and socio-economy is the prerequisite and foundation for scientifically delineating the spatial distribution of regional functional types on the Qinghai-Tibet Plateau and supporting regional sustainable development. This dataset is a basic data achievement formed during the implementation of the work of "Regional Functional Types and Zoning for Ecological Security Guarantee" under Task 4, Theme 6 of the Second Tibetan Plateau Scientific Expedition and Research (STEP) program. It covers the entire Qinghai-Tibet Plateau and three key regions: Lhasa City, Xining City and Nyingchi City, involving key elements such as topography, ecology, water and land resources, environment, population, transportation and public service infrastructure. Specifically, it includes 20 indicators: elevation, topographic slope, importance of biodiversity conservation function, importance of water conservation function, importance of soil and water conservation function, importance of windbreak and sand fixation function, importance of ecosystem service function, soil erosion sensitivity, land desertification sensitivity, ecological sensitivity, ecological conservation importance, construction land suitability, arable land suitability, water resource utilization suitability, environmental stress intensity, border security importance, population agglomeration degree, traffic support capacity, education service cost and medical service cost, which are spatially counted at county and township (subdistrict) levels respectively.
(1) Topographic factor indicators include elevation and topographic slope. Elevation data is derived from the NASADEM digital elevation model with a spatial resolution of 30 m, and is classified at 500 m intervals. Topographic slope is calculated based on the digital elevation model, and classified using thresholds of 3°, 5°, 8°, 12°, 15°, 20° and 25°.
(2) Ecological factor indicators include ecological conservation importance and its sub-indicators, which are calculated using the evaluation framework and methods specified in the *Guidelines for Delimiting Ecological Protection Red Lines*. First, six basic indicators, namely the importance of biodiversity conservation function, importance of water conservation function, importance of soil and water conservation function, importance of windbreak and sand fixation function, soil erosion sensitivity and land desertification sensitivity, are evaluated separately. The importance of ecosystem service function and ecological sensitivity are obtained by superimposing these indicators using the maximum value method, and ecological conservation importance is further integrated based on the above results. All indicators are classified into five levels: low, relatively low, general, relatively high and high.
(3) Water and land resource factor indicators include construction land suitability, arable land suitability and water resource utilization suitability. Construction land suitability is represented by the product of two indicators: air density parameter and slope construction suitability coefficient. Arable land suitability is represented by the product of air temperature parameter and soil anti-erodibility coefficient. These indicator parameters respectively reflect the air oxygen content and temperature changing with altitude, as well as the difficulty of carrying out construction activities and the potential soil erosion risk of arable land under different topographic slopes. The evaluation results are classified into five levels: unsuitable, barely suitable, generally suitable, relatively suitable and suitable. Water resource utilization suitability considers water resource accessibility and precipitation support capacity, where water resource accessibility is a distance function of water source reliability and water supply cost, and precipitation support capacity is the multi-year average precipitation. The evaluation results are classified into five levels: low, relatively low, general, relatively high and high.
(4) Environmental factor indicator is environmental stress intensity, which is comprehensively integrated by calculating the emission intensity of solid waste, water pollutants and atmospheric pollutants based on the spatial division of environmental pollution sources. The evaluation results are classified into five levels: low, relatively low, general, relatively high and high.
(5) Border security importance aims to classify border regions into different levels according to security degree through comprehensive assessment of China's border areas and their relations with adjacent countries. The evaluation indicators include the relative spatial location of border regions and the border line, the characteristics of adjacent countries and their strategic competition and cooperation relations with China, and the strategic hub status of border security. The evaluation results are classified into three levels: extremely important, relatively important and generally important.
(6) Population factor indicator is population agglomeration degree, which consists of two indicators: population density and population flow intensity. The data is derived from the 2020 Seventh National Population Census data at township (subdistrict) level. The evaluation results are classified into five levels: highly concentrated area, moderately concentrated area, lowly concentrated area, sparse area and extremely sparse area.
(7) Traffic and public service infrastructure indicators include traffic support capacity, education service cost and medical service cost. Traffic support capacity is obtained by integrating township resident site data and road data from field scientific investigation records, and generating cost raster data using the Cost Distance tool in ArcGIS software. Medical service cost uses indicators such as treatment time, population-weighted treatment time and comprehensive cost for first-, second- and third-level hospitals. The treatment time is the shortest time cost from each grid point to hospitals of different levels, which is calculated using the Cost Distance tool in ArcGIS based on the coordinates of hospitals of different levels and the cost raster data of the study area. The population-weighted treatment time is calculated by fitting cost raster through the OpenStreetMap (OSM) road network. The comprehensive cost integrates three indicators: population-weighted treatment time, per capita number of health technical personnel and per capita medical funding, and the comprehensive cost value is obtained by integrating with the indicator weights determined by the entropy weight method. Education service cost uses indicators such as primary school enrollment time, population-weighted enrollment time and comprehensive cost. The primary school enrollment time is the shortest time cost from each grid point to primary schools, which is calculated using the Cost Distance tool in ArcGIS based on the coordinates of primary schools and the cost raster data of the study area. The population-weighted enrollment time is obtained by fitting cost raster through the road network. The comprehensive cost integrates three indicators: population-weighted enrollment time, per-student number of teachers and per-student education funding, and the comprehensive cost value is obtained by integrating with the indicator weights determined by the entropy weight method. The road network data involved in the traffic and public service infrastructure indicators is from the OpenStreetMap platform. The hospital directory, number of health technical personnel and medical funding data are from the health commissions of each province (autonomous region). The primary school directory, number of teachers and education funding data are from the education departments of each province (autonomous region), with the time node being 2020.
提供机构:
徐勇,杨华,李九一,周侃,李佳洺,宋金平,程杨,戴特奇,田明,王丽佳
创建时间:
2025-05-13
搜集汇总
数据集介绍
背景与挑战
背景概述
该数据集是2020年青藏高原地域功能类型与区划的基础数据汇集,源自第二次青藏高原综合科学考察,覆盖青藏高原全域及拉萨、西宁、林芝三个重点地区,包含海拔高程、生态保护重要性、人口集聚度等20项指标,涉及地形、生态、水土资源、环境、人口、交通及公共服务基础设施等多维度要素,以县级和乡镇单元进行空间统计,旨在评估资源环境与社会经济关键要素的地域分异,为区域可持续发展提供数据支撑。
以上内容由遇见数据集搜集并总结生成


