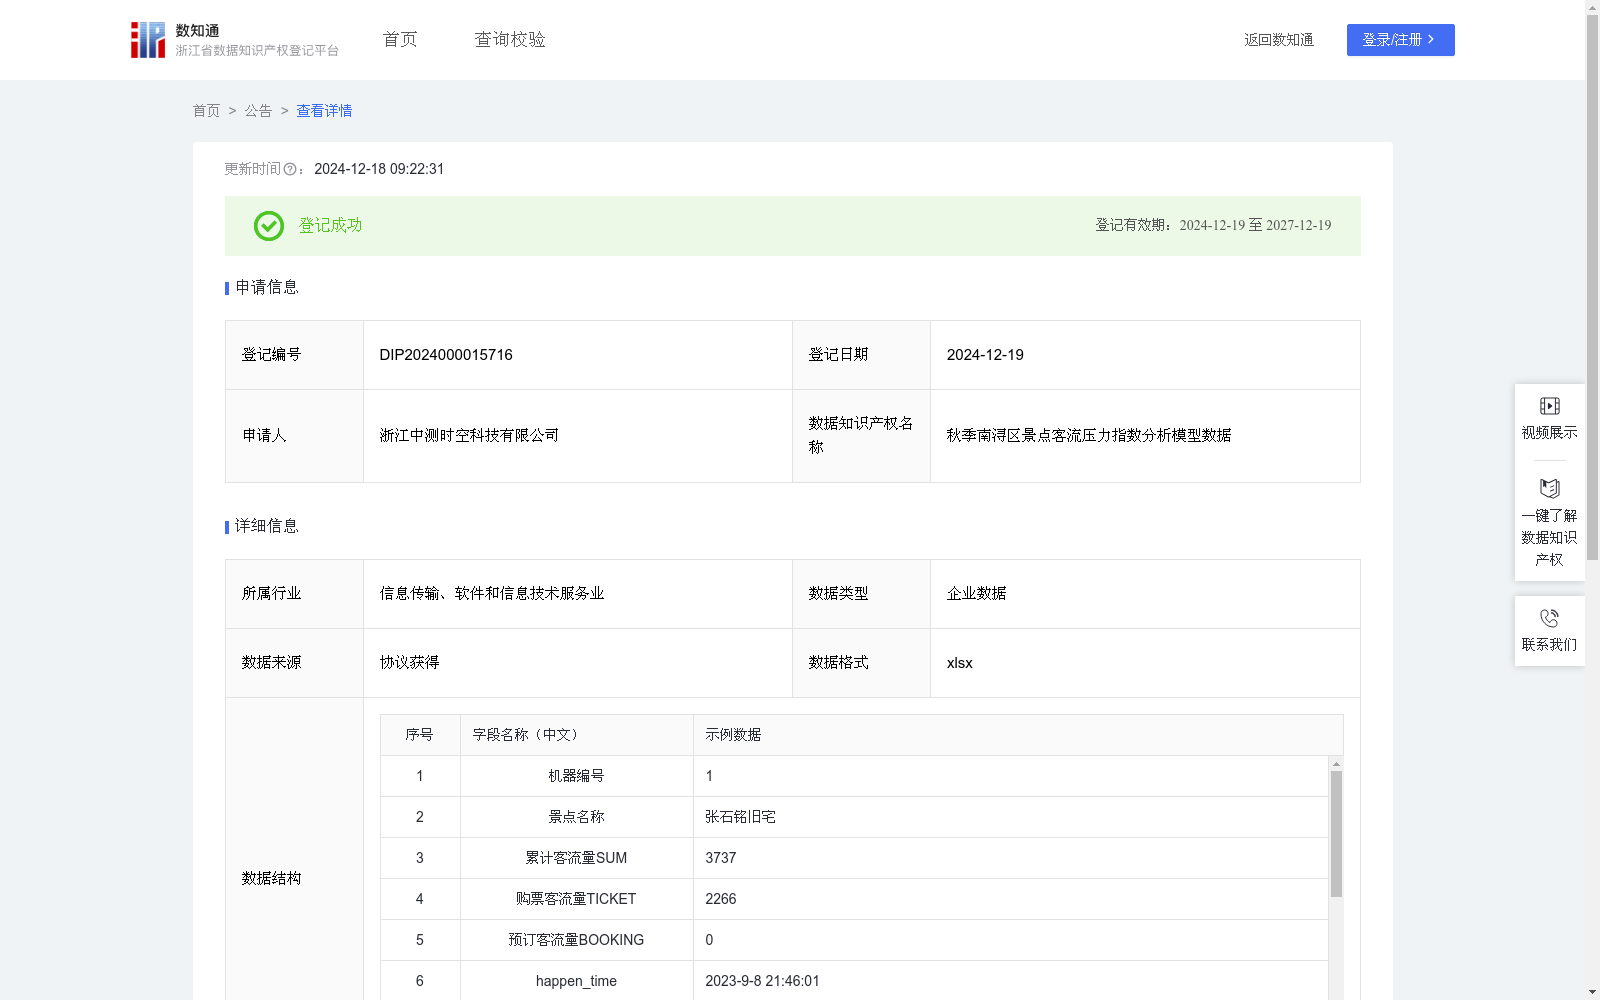
秋季南浔区景点客流压力指数分析模型数据
收藏浙江省数据知识产权登记平台2024-12-18 更新2024-12-19 收录
下载链接:
https://www.zjip.org.cn/home/announce/trends/106406
下载链接
链接失效反馈官方服务:
资源简介:
不同季节景区吸引力有所差异,景点景观,游客在进出景区的选择上也不同,现场购票,预定,其他方式(如旅行团队,教育活动等)。研究秋季南浔区不同景点客流压力指数分析模型数据,通过科学合理地构建和应用相应指标、算法,广泛应用于帮助景区进行人员调配,统筹布局,安全情况追踪,相关旅游业配套企业也可以更加精准地把握客流状态安排经营计划,为制定有效的经营策略和发展规划提供有力支持;地区可以更加深入分析景区客流情况,压力指数,文旅经济与区域发展的内在联系,评估区域产业的具体政策,持续发展能力和市场竞争力,对广大景区具有示范指导作用。1.数据来源:数据来源于南浔古镇实景三维-一网统管平台,根据秋季南浔区各景区实际情况实时记录,我公司已获得统管平台所有权人“浙江南浔古镇旅游发展有限公司”数据使用授权许可。2.算法:输入客流量相关数据,包括景点名称,累计客流量SUM,购票客流量TICKET,其中happen_time,update_date,create_date三项为记录系统直出数据.进行数据清洗,避免重大误差影响计算。计算不同景区的其他方式客流量X(团队旅游,教育活动等需要人工辅助或特别关注的游客群体),X=SUM-TICKET-BOOKING;计算不同景区的压力指数P,P=(TICKET/SUM-BOOKING/SUM-X/SUM)x100%;3.数据复用:压力指数P的大小作用于不同方向:针对景区电子通过设备,P越高则证明通过设备客流压力越大,人员聚集越多,可将重点安保向电子通过设备所在区域调配;针对人工核验部门,P越低则证明人工核验压力越大,人员聚集越多,可将重点安保向人工核验所在区域调配。
Scenic spot attractiveness varies across seasons, as do the landscape of attractions and tourists' choices for entering and exiting scenic spots, which include on-site ticket purchase, pre-ordered tickets, and other channels (e.g., tour groups, educational events, etc.). Research on the passenger flow pressure index analysis model data for different scenic spots in Nanxun District during autumn: By scientifically and rationally constructing and applying corresponding indicators and algorithms, this work can be widely applied to assist scenic spots in personnel deployment, overall layout planning, and safety monitoring. Relevant tourism supporting enterprises can also accurately grasp passenger flow status to arrange business plans, providing strong support for formulating effective business strategies and development plans. Regions can further analyze the internal connections among scenic spot passenger flow, pressure index, cultural tourism economy and regional development, evaluate specific industrial policies, sustainable development capabilities and market competitiveness of regional industries, which has exemplary and guiding significance for most scenic spots.
1. Data Source: The data comes from the Real-scene 3D "One-net Unified Management" Platform of Nanxun Ancient Town, which is recorded in real time based on the actual operation of each scenic spot in Nanxun District during autumn. Our company has obtained the data usage authorization from the platform's owner, "Zhejiang Nanxun Ancient Town Tourism Development Co., Ltd."
2. Algorithm: Input passenger flow-related data, including scenic spot name, total passenger flow SUM, on-site ticket purchase passenger flow TICKET. Among them, happen_time, update_date and create_date are directly exported data from the recording system. First, perform data cleaning to avoid major errors affecting the calculation. Calculate the passenger flow X of other channels for different scenic spots (tourist groups requiring manual assistance or special attention, such as tour groups, educational events), where X = SUM - TICKET - BOOKING. Then calculate the pressure index P for different scenic spots, where P = (TICKET/SUM - BOOKING/SUM - X/SUM) × 100%.
3. Data Reusability: The magnitude of pressure index P serves different application directions: For electronic passage equipment in scenic spots, the higher P is, the greater the passenger flow pressure and the more concentrated the crowd will be, so key security forces can be deployed to the area where the electronic passage equipment is located. For manual inspection departments, the lower P is, the greater the manual inspection pressure and the more concentrated the crowd will be, so key security forces can be deployed to the area where the manual inspection is located.
提供机构:
浙江中测时空科技有限公司
创建时间:
2024-11-15
搜集汇总
数据集介绍
特点
该数据集提供了秋季南浔区景点的客流压力指数分析模型数据,包含644条记录,数据格式为xlsx。通过分析客流量数据,计算景区压力指数,支持景区管理和旅游业经营策略的制定。
以上内容由遇见数据集搜集并总结生成


