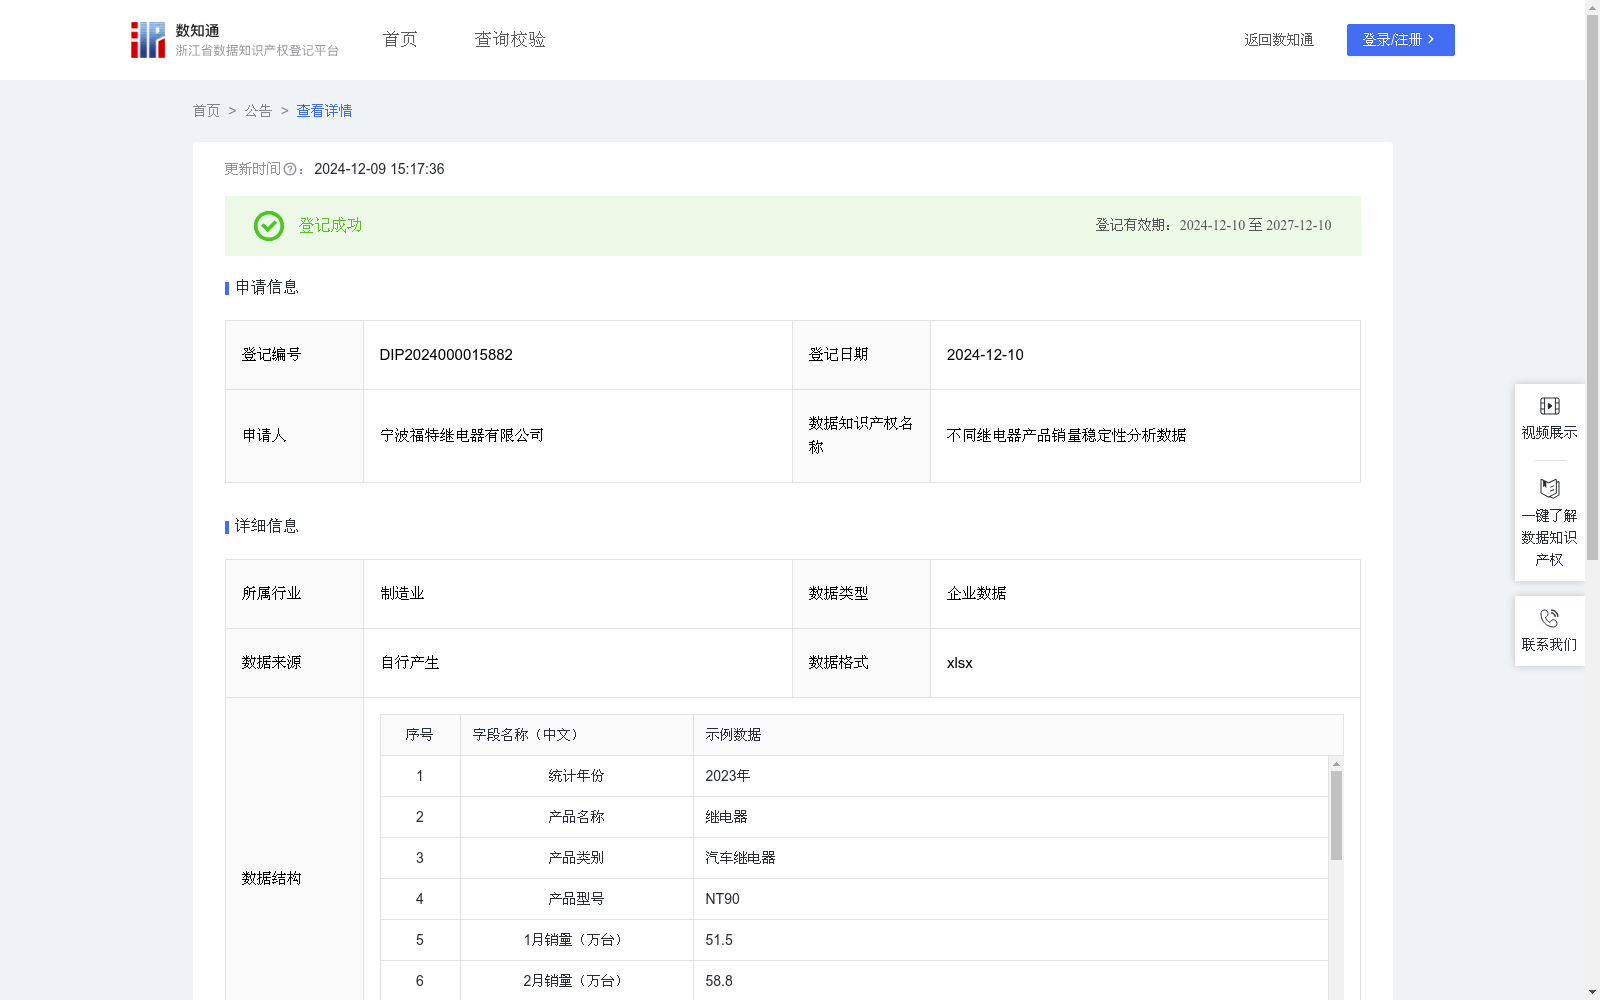
不同继电器产品销量稳定性分析数据
收藏浙江省数据知识产权登记平台2024-12-09 更新2024-12-10 收录
下载链接:
https://www.zjip.org.cn/home/announce/trends/98557
下载链接
链接失效反馈官方服务:
资源简介:
销量稳定性是衡量市场健康状况的重要指标。本数据有助于本公司参考不同继电器产品销量的稳定性结果来调整优化市场营销策略。 继电器产品制造商和市场分析机构可以参考、分析本数据,识别不同继电器产品的销售稳定性情况,为继电器产品的选择和对不同类别继电器产品市场的判断提供辅助参考。1.数据收集和预处理:(1)数据收集:收集公司内部销售管理平台对于不同继电器产品的销售统计信息,具体包括统计年份、产品名称、产品类别、产品型号、1月销量、2月销量、3月销量、4月销量、5月销量、6月销量、7月销量、8月销量、9月销量、10月销量、11月销量、12月销量。(2)数据预处理:对采集到的原始数据进行处理,去除缺失和异常数据。 2.数据汇总:将1至12月的销量汇总,计算得到年度总销量。 3.建立销量稳定性分析模型:(1)计算月平均销售量:计算月平均销售量=年度总销量/12;(2)计算月销售量方差:月销售量方差=[(1月销量-月平均销售量)^2+(2月销量-月平均销售量)^2+(3月销量-月平均销售量)^2+…+(12月销量-月平均销售量)^2]/12;(3)销量稳定性分析:基于内部专家研讨,确定当方差小于1000,则分析结论为“销量很平稳”;当方差大于等于1000且小于等于5000,则分析结论为“销量一般平稳”;当方差大于5000,则分析结论为“销量波动大”。
Sales stability is a critical indicator for measuring market health. This dataset enables the company to adjust and optimize its marketing strategies by referencing the sales stability results of different relay products. Relay product manufacturers and market analysis institutions can also refer to and analyze this dataset to identify the sales stability of various relay products, providing auxiliary references for relay product selection and market judgment of different relay product categories.
1. Data Collection and Preprocessing:
(1) Data Collection: Collect sales statistics of different relay products from the company's internal sales management platform, specifically including statistical year, product name, product category, product model, sales volume in January, February, March, April, May, June, July, August, September, October, November, and December.
(2) Data Preprocessing: Process the collected raw data by removing missing and abnormal data entries.
2. Data Aggregation: Aggregate the sales volumes from January to December to calculate the annual total sales volume.
3. Establishment of Sales Stability Analysis Model:
(1) Monthly Average Sales Calculation: Calculate monthly average sales = Annual total sales volume / 12;
(2) Monthly Sales Variance Calculation: Monthly sales variance = [(January sales - monthly average sales)² + (February sales - monthly average sales)² + (March sales - monthly average sales)² + … + (December sales - monthly average sales)²] / 12;
(3) Sales Stability Analysis: Based on internal expert discussions, the analysis conclusions are determined as follows: if the variance is less than 1000, the conclusion is "Sales are very stable"; if the variance is greater than or equal to 1000 and less than or equal to 5000, the conclusion is "Sales are generally stable"; if the variance is greater than 5000, the conclusion is "Sales have large fluctuations".
提供机构:
宁波福特继电器有限公司
创建时间:
2024-11-15
搜集汇总
数据集介绍
特点
该数据集提供了2023年不同继电器产品的月度销量数据,并通过计算月平均销量和月销量方差,分析了销量的稳定性。数据集适用于制造商和市场分析机构,用于评估产品销售的稳定性并优化市场策略。
以上内容由遇见数据集搜集并总结生成


