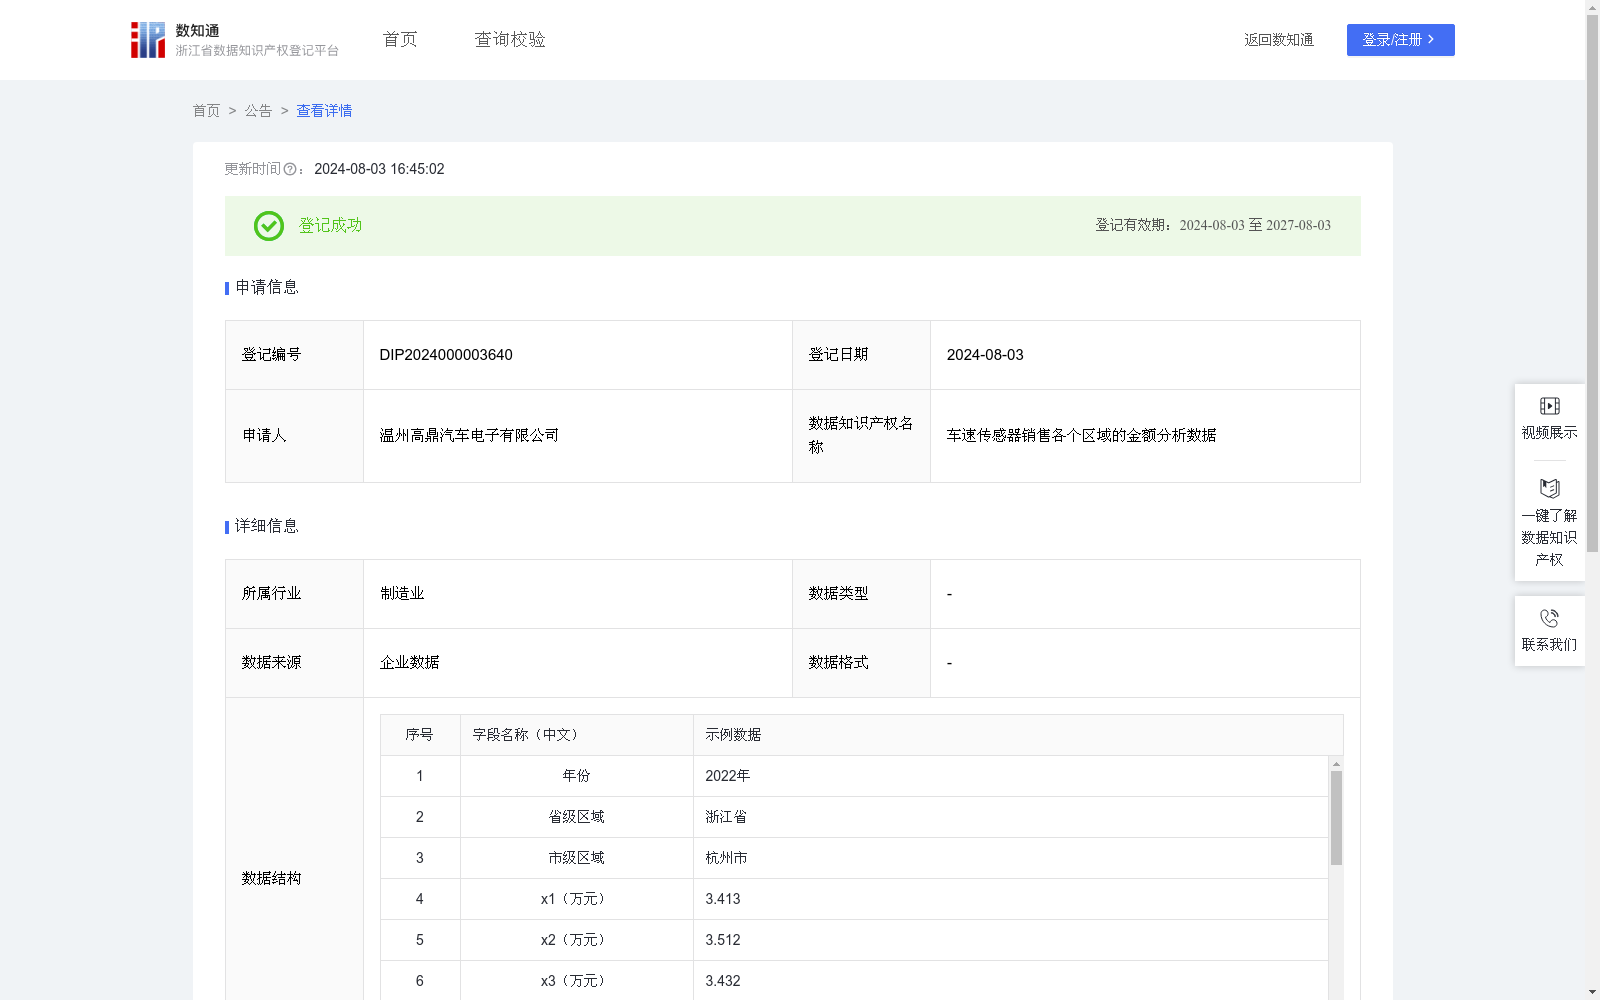
车速传感器销售各个区域的金额分析数据
收藏浙江省数据知识产权登记平台2024-08-03 更新2024-08-04 收录
下载链接:
https://www.zjip.org.cn/home/announce/trends/47296
下载链接
链接失效反馈官方服务:
资源简介:
通过销帮帮CRM交易平台采集本公司的销售订单,将不同的销售订单以各自的省市来划分,从而计算各个市每个月的销售金额,再计算出12个月的销售金额的方差大小,方差大小用来评价各个市的销售情况,从而用于评估所有企业的生产和销售策略,所有企业可以通过该数据了解车速传感器在不同省市的销售行情,以平衡生产和销售车速传感器数量。步骤1:通过销帮帮CRM交易平台采集本公司的销售订单,将不同的销售订单以省市来划分归类,从而将各年度每个月销售至不同省市的金额,从一月至十二月依次用x1,x2...x12表示,并汇总计算得到各个市当年的总销售金额x。步骤2:计算各市的月平均销售金额x̅=各个市当年的总销售金额x/12。步骤3:根据方差公式计算方差s2={(x1-x̅)2+(x2-x̅)2+(x3-x̅)2+…+(x12-x̅)2}/12,从而得到各个市的月销售金额的方差s2大小。步骤4:当方差s2小于0.15评价该市为销售超平稳型市。当方差s2大于等于0.15并且小于等于0.3评价该省市份为销售一般平稳型市。当方差s2大于0.3评价该省市份为销售波动型市。对于销售超平稳型市,所有企业无需时时关注该市的行情,可每月保持好车速传感器的生产和销售数量;对于销售一般平稳型市,所有企业需每季度关注该市的行情,适当调整车速传感器的生产和销售数量;而对于销售波动型市,所有企业需每月时时关注该市行情,了解该市的销售行情变化,以适应大幅度调整车速传感器的生产和销售数量变化。
This dataset is developed by collecting the company's sales orders via the Xiaobangbang CRM platform. Sales orders are categorized by their corresponding provinces and cities to calculate the monthly sales revenue for each city. The variance of the 12-month sales revenue is then calculated to evaluate the sales performance of each city, which can be used to assess the production and sales strategies of all enterprises. Enterprises can use this dataset to grasp the sales trends of vehicle speed sensors across different provinces and cities, so as to balance the production and sales volumes of vehicle speed sensors.
Step 1: Collect the company's sales orders via the Xiaobangbang CRM platform, and classify different sales orders by provinces and cities. The monthly sales revenue for each city in a given year is denoted as x₁, x₂, ..., x₁₂ from January to December, and the total annual sales revenue x for each city is obtained by summing up the monthly values.
Step 2: Calculate the monthly average sales revenue ar{x} for each city, where ar{x} = x / 12, with x being the total annual sales revenue of the city.
Step 3: Compute the variance s² of the monthly sales revenue for each city using the variance formula: s² = [(x₁ - ar{x})² + (x₂ - ar{x})² + (x₃ - ar{x})² + ... + (x₁₂ - ar{x})²] / 12, thus obtaining the variance s² of the monthly sales revenue for each city.
Step 4: Classify each city based on the computed variance:
- Cities with s² < 0.15 are classified as ultra-stable sales cities;
- Cities with 0.15 ≤ s² ≤ 0.3 are classified as generally stable sales cities;
- Cities with s² > 0.3 are classified as volatile sales cities.
For ultra-stable sales cities, enterprises do not need to closely monitor their sales trends regularly, and can maintain stable production and sales volumes of vehicle speed sensors. For generally stable sales cities, enterprises need to monitor their sales trends quarterly and appropriately adjust the production and sales volumes of vehicle speed sensors. For volatile sales cities, enterprises need to closely monitor their sales trends monthly, track changes in local sales conditions, and make significant adjustments to the production and sales volumes of vehicle speed sensors accordingly.
提供机构:
温州高鼎汽车电子有限公司
创建时间:
2024-07-18
搜集汇总
数据集介绍
特点
该数据集提供了车速传感器在不同省市的销售金额分析,包含年度、省市区域、各月销售金额及方差等字段,适用于企业评估生产和销售策略。数据规模为613条,每年更新一次。
以上内容由遇见数据集搜集并总结生成


