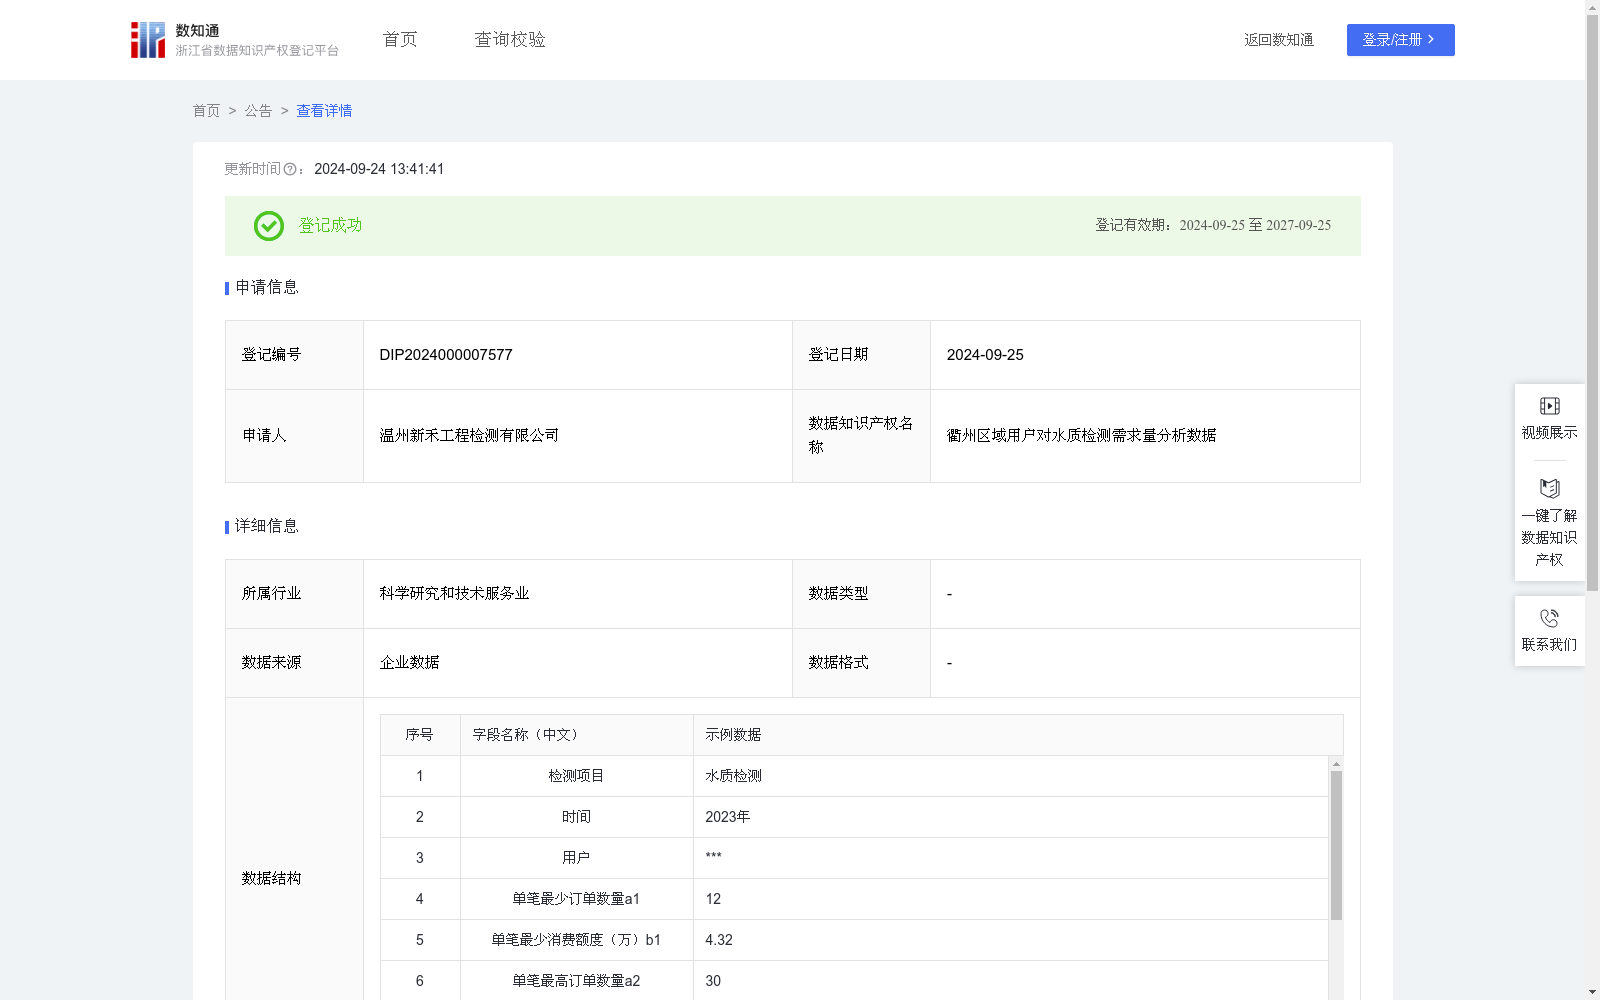
衢州区域用户对水质检测需求量分析数据
收藏浙江省数据知识产权登记平台2024-09-24 更新2024-09-25 收录
下载链接:
https://www.zjip.org.cn/home/announce/trends/64289
下载链接
链接失效反馈官方服务:
资源简介:
通过收集和分析衢州区域用户对水质检测的需求量、消费相关数据,了解用户对水质检测需求量的购买力水平和消费偏好,为本行业的所有企业提供依据,更好的为用户提供个性化的商品和服务,从而制定更精准的营销策略。1.数据采集:采集用户对水质检测的相关交易数据。2.数据处理:对采集到的数据进行分类、合并、累加,便于分析使用。3.算法加工:将处理后的数据进行需求量分析,P=(单笔最少订单数量a1/单笔最少消费额度b1+单笔最高订单数量a2/单笔最高消费额度b2+平均订单数量a3/平均消费额度b3)*K,K为消费系数,不同区域系数大小值不同,按经验取值衢州K值为0.8。4.数据分类分级:根据计算出的需求量水平,将用户等级划分为“高、中、低”(10分以上标记为“高等级”,1-10分区间内标记为“中等级”,1分以下标记为“低等级”,有助于更好的梳理用户,高等级可每月1至2次进行沟通,中等级可每季度1至2次进行沟通,低等级可半年1至2次进行沟通,从而制定更精准的营销策略。
This dataset is developed by collecting and analyzing water quality testing demand and consumption-related data of users in Quzhou region, aiming to understand the purchasing power and consumption preferences of users regarding water quality testing services, provide a reference basis for all enterprises in this industry, better deliver personalized products and services to users, and formulate more precise marketing strategies. 1. Data Collection: Collect relevant transaction data of users' water quality testing demands. 2. Data Processing: Classify, merge and accumulate the collected data to facilitate subsequent analysis. 3. Algorithm Processing: Conduct demand analysis on the processed data using the formula: $P = (a_1/b_1 + a_2/b_2 + a_3/b_3) * K$, where $a_1$ refers to the minimum single-order quantity, $b_1$ refers to the minimum single-order consumption amount, $a_2$ refers to the maximum single-order quantity, $b_2$ refers to the maximum single-order consumption amount, $a_3$ refers to the average order quantity, $b_3$ refers to the average order consumption amount, and $K$ is the consumption coefficient with different values for different regions. The empirical value of $K$ for Quzhou is 0.8. 4. Data Classification and Grading: Divide user levels into "High", "Medium" and "Low" based on the calculated demand level: users with a score above 10 are marked as "High Level", those with a score within the range of 1 to 10 are marked as "Medium Level", and those with a score below 1 are marked as "Low Level". This classification helps to better sort out user groups: communicate with High Level users 1 to 2 times per month, with Medium Level users 1 to 2 times per quarter, and with Low Level users 1 to 2 times every six months, so as to develop more precise marketing strategies.
提供机构:
温州新禾工程检测有限公司
创建时间:
2024-09-02
搜集汇总
数据集介绍
以上内容由遇见数据集搜集并总结生成


