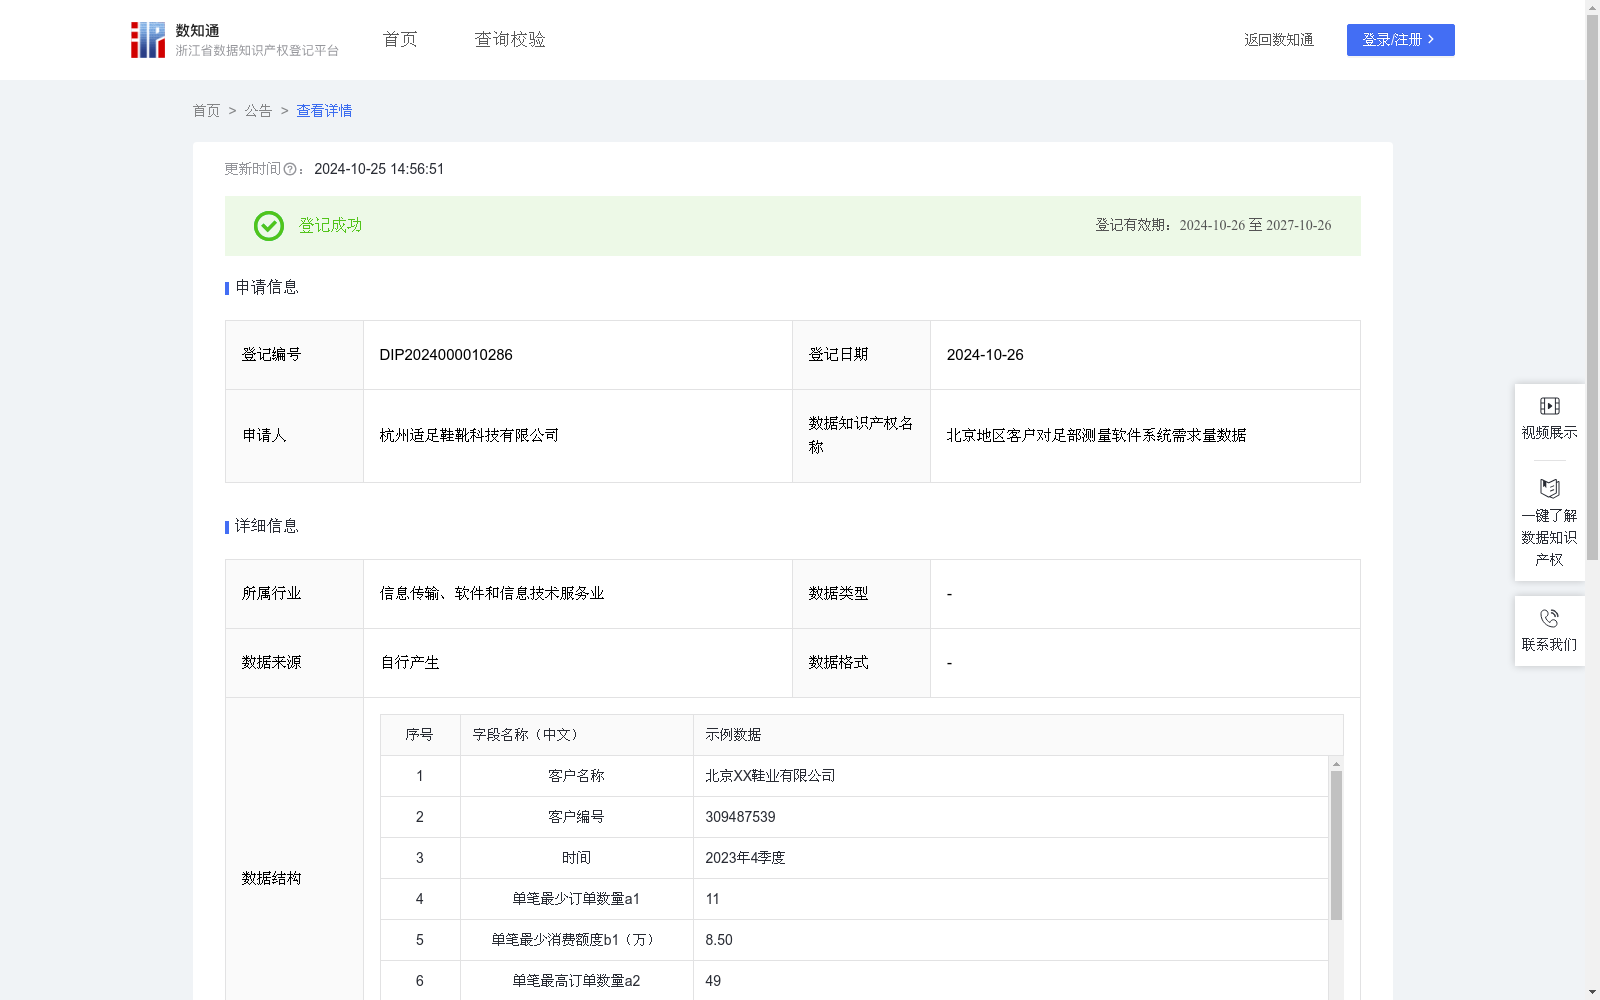
北京地区客户对足部测量软件系统需求量数据
收藏浙江省数据知识产权登记平台2024-10-25 更新2024-10-26 收录
下载链接:
https://www.zjip.org.cn/home/announce/trends/75722
下载链接
链接失效反馈官方服务:
资源简介:
通过收集和分析北京地区客户对足部测量软件系统的需求量数据与消费相关数据,了解客户对足部测量软件系统的需求量的购买力水平和消费偏好,以及了解足部测量软件系统在北京地区是否畅销,从而为本行业的企业制定足部测量软件系统销售策略提供参考,更好地为客户提供个性化的商品和服务。1.数据采集:采集本公司在北京地区客户的足部测量软件系统需求量相关交易订单数据。2.数据处理:对采集到数据进行分类、合并、累加,便于分析使用。3.算法加工:将处理后的数据进行需求量分析:P={a1(单笔最少订单数量)/b1(单笔最少消费额度)+a2(单笔最高订单数量)/b2(单笔最高消费额度)+a3(平均订单数量)/b3(平均消费额度)}*k,k为消费系数,不同地区系数大小值不同,按经验取值北京地区k值为0.8。4、数据分类分级:把所有参与计算的公司需求指数从高到低排序,按照赋分制对公司的需求指数进行百分制赋分(需求指数5赋分85,需求指数3赋分65,指数每0.1对应赋分1分,以次类推),将客户等级划分为“高、中、低”不同的类别和级别(85分以上标记为“高等级”,65-85分区间内标记为“中等级”,65分以下标记为“低等级”),帮助公司更好地理解客户,高等级企业可每月1至2次与企业沟通,中等级可每季度1至2次与企业沟通,低等级企业可每半年1至2次与企业沟通,从而制定更精准的生产与销售策略。
This dataset is developed by collecting and analyzing customer demand and consumption-related data for foot measurement software systems in the Beijing area, to understand customers' purchasing power, consumption preferences, and the market popularity of foot measurement software systems in the region, so as to provide references for enterprises in the industry to formulate sales strategies for such software systems and better provide personalized products and services.
1. Data Collection: Collect transaction order data related to the demand for foot measurement software systems from the company's customers in the Beijing area.
2. Data Processing: Classify, merge and accumulate the collected data to facilitate subsequent analysis work.
3. Algorithm Processing: Conduct demand analysis on the processed data with the following formula:
P = {a1 (minimum single-order quantity)/b1 (minimum single-order consumption amount) + a2 (maximum single-order quantity)/b2 (maximum single-order consumption amount) + a3 (average order quantity)/b3 (average consumption amount)} * k
Here, k is the consumption coefficient, which varies across different regions. Based on empirical experience, the k value for the Beijing area is 0.8.
4. Data Classification and Grading: Sort all calculated company demand indexes in descending order, and assign percentage-based scores using a scoring system: a demand index of 5 corresponds to 85 points, a demand index of 3 corresponds to 65 points, with each 0.1 change in the demand index corresponding to a 1-point adjustment in the score. Then divide customers into three categories and tiers: "High-level" for enterprises with scores above 85, "Medium-level" for those with scores between 65 and 85, and "Low-level" for those with scores below 65. This helps enterprises better understand their customers: communicate with high-level enterprises 1 to 2 times per month, with medium-level enterprises 1 to 2 times per quarter, and with low-level enterprises 1 to 2 times every six months, so as to formulate more precise production and sales strategies.
提供机构:
杭州适足鞋靴科技有限公司
创建时间:
2024-09-27
搜集汇总
数据集介绍
以上内容由遇见数据集搜集并总结生成


