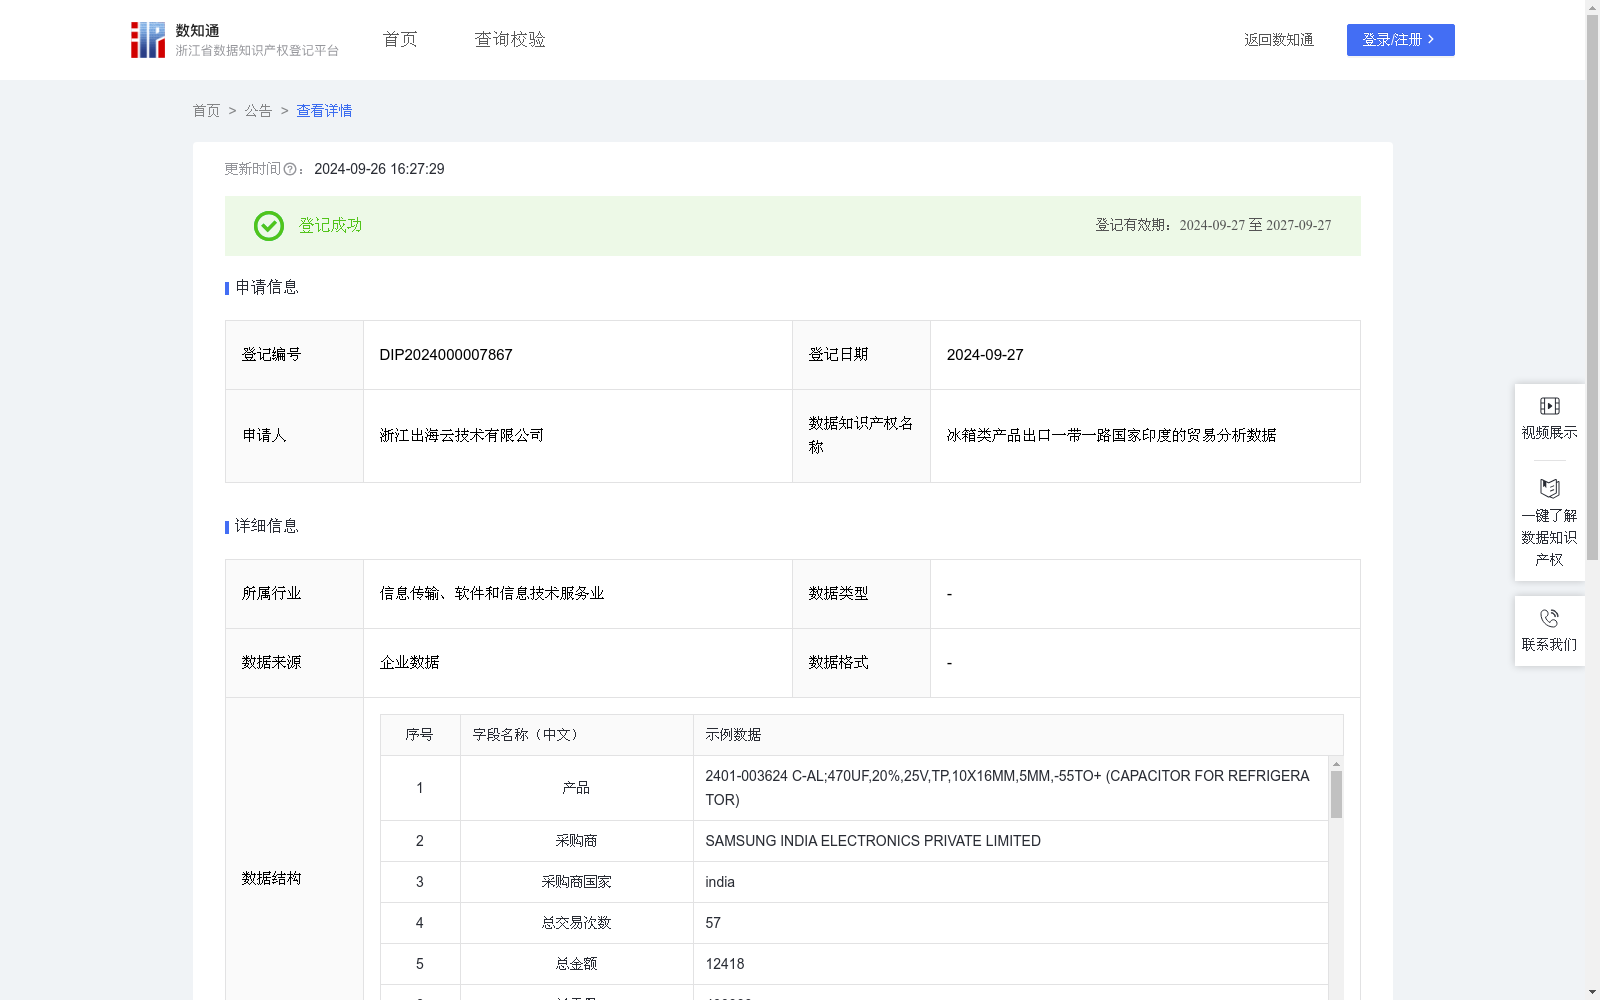
冰箱类产品出口一带一路国家印度的贸易分析数据
收藏浙江省数据知识产权登记平台2024-09-26 更新2024-09-27 收录
下载链接:
https://www.zjip.org.cn/home/announce/trends/65556
下载链接
链接失效反馈官方服务:
资源简介:
本数据通过分析冰箱类产品在一带一路国家印度的贸易情况,可以帮助从事冰箱类产品加工、制造、销售的企业解决以下问题:1.评估产品出口:通过往年数据了解自身行业在该国家的淡旺季,以平衡生产和出口数量。2.了解市场:清晰地了解市场规模及其变化趋势,为制定市场进入策略和长期发展规划提供数据支持。3.指导战略决策:利用该数据来指导企业战略方向的制定,确保资源投入能够聚焦于提升企业竞争能力的关键环节。4.行业竞争策略:利用该数据了解和分析同行业产品出口数据信息,来衡量自身的市场竞争力,从而优化和调整企业策略,调整销售渠道布局,制定更加精准的营销策略。5.增强客户体验:使用数据来度量和改善产品的需求情况,为客户提供针对性的指导意见,从而提升客户满意度和忠诚度。6.促进产品创新:揭示该国家采购商对冰箱类产品的偏好和需求差异,有助于企业进行市场细分,更好地理解市场需求和技术趋势,并针对不同市场推出更具针对性的产品,从而推动产品的创新。1、计算产品每季度的交易占比:该产品某季度交易次数占比=(该季度交易次数/总交易次数)*100%,后取小数点后两位;该产品某季度金额占比=(该季度交易金额/总金额)*100,后取小数点后两位;该产品某季度的重量占比=(该季度交易重量/总重量)*100,后取小数点后两位。2、先求和再计算各产品占比的平均值:百分比平均值AVG =(一季度交易次数占比+二季度交易次数占比+三季度交易次数占比+四季度交易次数占比)/4。3、计算每个产品各季度交易占比与平均值的差的平方:Σ=(各季度交易次数占比-百分比平均值AVG)²,依次用D1、D2、D3、D4表示。4、计算方差:S = (D1+D2+D3+D4)/4。5:计算标准差:σ= sqrt(S)。6:根据各产品四个季度的交易情况,程序依据以上算法自动计算得出该产品需求程度以及结果说明:当σ小于2,当前商品为高需求商品,当σ大于等于2并且小于等于5,当前商品为中等需求商品,其余的为低需求商品。
This dataset analyzes trade data of refrigerator products in India, a country along the Belt and Road, and can help enterprises engaged in the processing, manufacturing, and sales of refrigerator products address the following issues:
1. Assess product exports: Leveraging historical trade data, enterprises can identify the peak and off-peak sales seasons of their industry in India, thereby balancing production and export volumes.
2. Gain market insights: Clearly understand the market size and its evolving trends, providing data support for developing market entry strategies and long-term development plans.
3. Guide strategic decision-making: Utilize this data to guide the formulation of corporate strategic directions, ensuring that resource investment focuses on key links that enhance corporate competitiveness.
4. Formulate industry competition strategies: Use this data to analyze and understand export data of peer products, measure one's own market competitiveness, optimize and adjust corporate strategies, revise sales channel layouts, and develop more precise marketing strategies.
5. Enhance customer experience: Employ data to measure and improve product demand, provide targeted guidance to customers, and thus improve customer satisfaction and loyalty.
6. Promote product innovation: Reveal the preferences and demand differences of Indian buyers for refrigerator products, enabling enterprises to conduct market segmentation, better comprehend market demands and technological trends, and launch more targeted products for different markets, thereby driving product innovation.
The specific data calculation steps are as follows:
1. Calculate the quarterly transaction proportion of the product:
- Quarterly transaction count proportion = (number of transactions in the quarter / total number of transactions) * 100%, rounded to two decimal places;
- Quarterly transaction amount proportion = (transaction amount in the quarter / total transaction amount) * 100, rounded to two decimal places;
- Quarterly transaction weight proportion = (transaction weight in the quarter / total transaction weight) * 100, rounded to two decimal places.
2. Calculate the average percentage value of the quarterly proportions:
Percentage average AVG = (Q1 transaction count proportion + Q2 transaction count proportion + Q3 transaction count proportion + Q4 transaction count proportion) / 4.
3. Calculate the squared difference between each quarterly proportion and the average value:
Σ = (quarterly transaction proportion - percentage average AVG)², denoted as D1, D2, D3, and D4 sequentially.
4. Calculate the variance: S = (D1 + D2 + D3 + D4) / 4.
5. Calculate the standard deviation: σ = sqrt(S).
6. Based on the quarterly transaction status of each product, the program automatically calculates the product's demand level and provides corresponding result descriptions via the above algorithm: When σ < 2, the product is categorized as a high-demand product; when 2 ≤ σ ≤5, the product is categorized as a medium-demand product; all others are low-demand products.
提供机构:
浙江出海云技术有限公司
创建时间:
2024-09-05
搜集汇总
数据集介绍
特点
该数据集详细记录了冰箱类产品出口到印度的贸易数据,包含1501条记录,每年更新一次。数据按季度统计了交易次数、金额、重量等指标,并通过方差和标准差评估了需求程度,为企业提供市场分析和战略决策支持。
以上内容由遇见数据集搜集并总结生成


