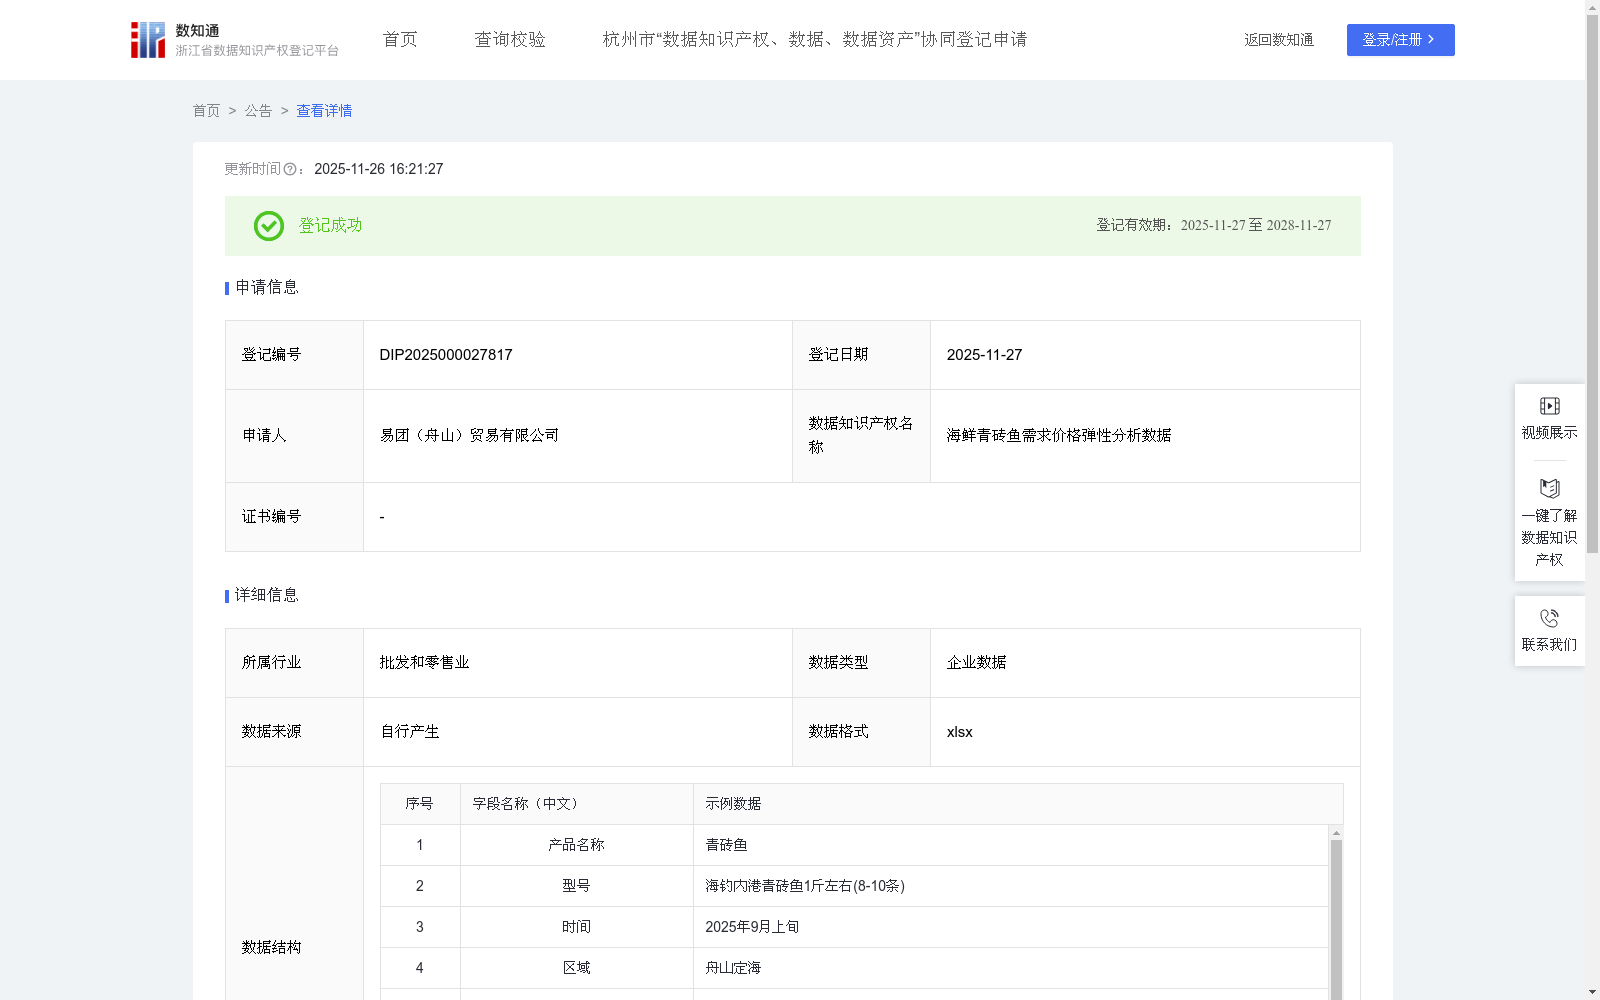
海鲜青砖鱼需求价格弹性分析数据
收藏资源简介:
相对于其他的鱼类,青砖鱼价格亲民,是普通家庭通过膳食便捷(补充高级不饱和脂肪酸(如DHA和EPA))的绝佳选择。本分析聚焦于海鲜品类中青砖鱼的需求价格弹性,揭示了产品价格与市场需求之间的动态联系。为渔业公司提供了重要的决策依据,具有显著的应用价值,有助于在渔业捕捞成本波动背景下制定更具弹性的定价策略。对下游商超、餐饮机构而言,基于该分析数据可优化供应链管理与采购策略,提升成本控制能力与市场应变速度。1.数据采集:采集相关青砖鱼需求数据和价格数据,按照时间及区域进行整理归纳,采集青砖鱼的需求量变动数值和价格变化数值。2.算法规则:对采集得到的数据按照如下公式进行计算:需求弹性系数Ed=-(△Q/Q)÷(△P/P),得到需求弹性系数。式中:Q表示产品的需求量,单位为份;P表示产品的价格,单位为元;△Q表示需求量同比变动值,单位为份;△P表示价格同比变动值,单位为元。取需求弹性系数的绝对值|Ed|作为分析数据时的参考系数。3.数据分析:根据∣Ed∣的数值可分析青砖鱼产品的需求价格弹性:若∣Ed∣=1,则判定为"需求单一弹性",说明需求量变动幅度与价格变动幅度相同;若∣Ed∣>1,则判定为"需求富有弹性",说明需求量变动幅度大于价格变动幅度;若∣Ed∣<1,则判定为"需求缺乏弹性",说明需求量变动幅度小于价格变动幅度。
Compared with other fish, the Pacific chub mackerel is affordably priced, making it an excellent choice for ordinary households to conveniently obtain dietary supplementation of high-grade unsaturated fatty acids such as DHA and EPA. This analysis focuses on the price elasticity of demand for Pacific chub mackerel within the seafood category, revealing the dynamic relationship between product prices and market demand. It provides critical decision-making support for fishery enterprises, holds significant practical application value, and helps formulate more flexible pricing strategies amid fluctuations in fishery harvesting costs. For downstream supermarkets and catering institutions, leveraging the analysis data can optimize supply chain management and procurement strategies, enhancing cost control capabilities and market responsiveness. 1. Data Collection: Collect relevant demand and price data of Pacific chub mackerel, organize and categorize them by time and region, and gather the year-on-year change values of the fish's demand and price. 2. Algorithmic Rules: Calculate the collected data using the following formula for Price Elasticity of Demand: $E_d = -(Delta Q / Q) div (Delta P / P)$ to obtain the demand elasticity coefficient. In the formula: Q represents the product demand, with the unit of servings; P represents the product price, with the unit of yuan; $Delta Q$ represents the year-on-year change in demand, with the unit of servings; $Delta P$ represents the year-on-year change in price, with the unit of yuan. Take the absolute value of the demand elasticity coefficient $|E_d|$ as the reference coefficient for data analysis. 3. Data Analysis: Analyze the price elasticity of demand for Pacific chub mackerel based on the value of $|E_d|$: If $|E_d| = 1$, it is classified as "unitary price elasticity of demand", indicating that the change magnitude of demand is consistent with that of price; If $|E_d| > 1$, it is classified as "relatively elastic demand", meaning the change magnitude of demand is greater than that of price; If $|E_d| < 1$, it is classified as "relatively inelastic demand", indicating that the change magnitude of demand is smaller than that of price.