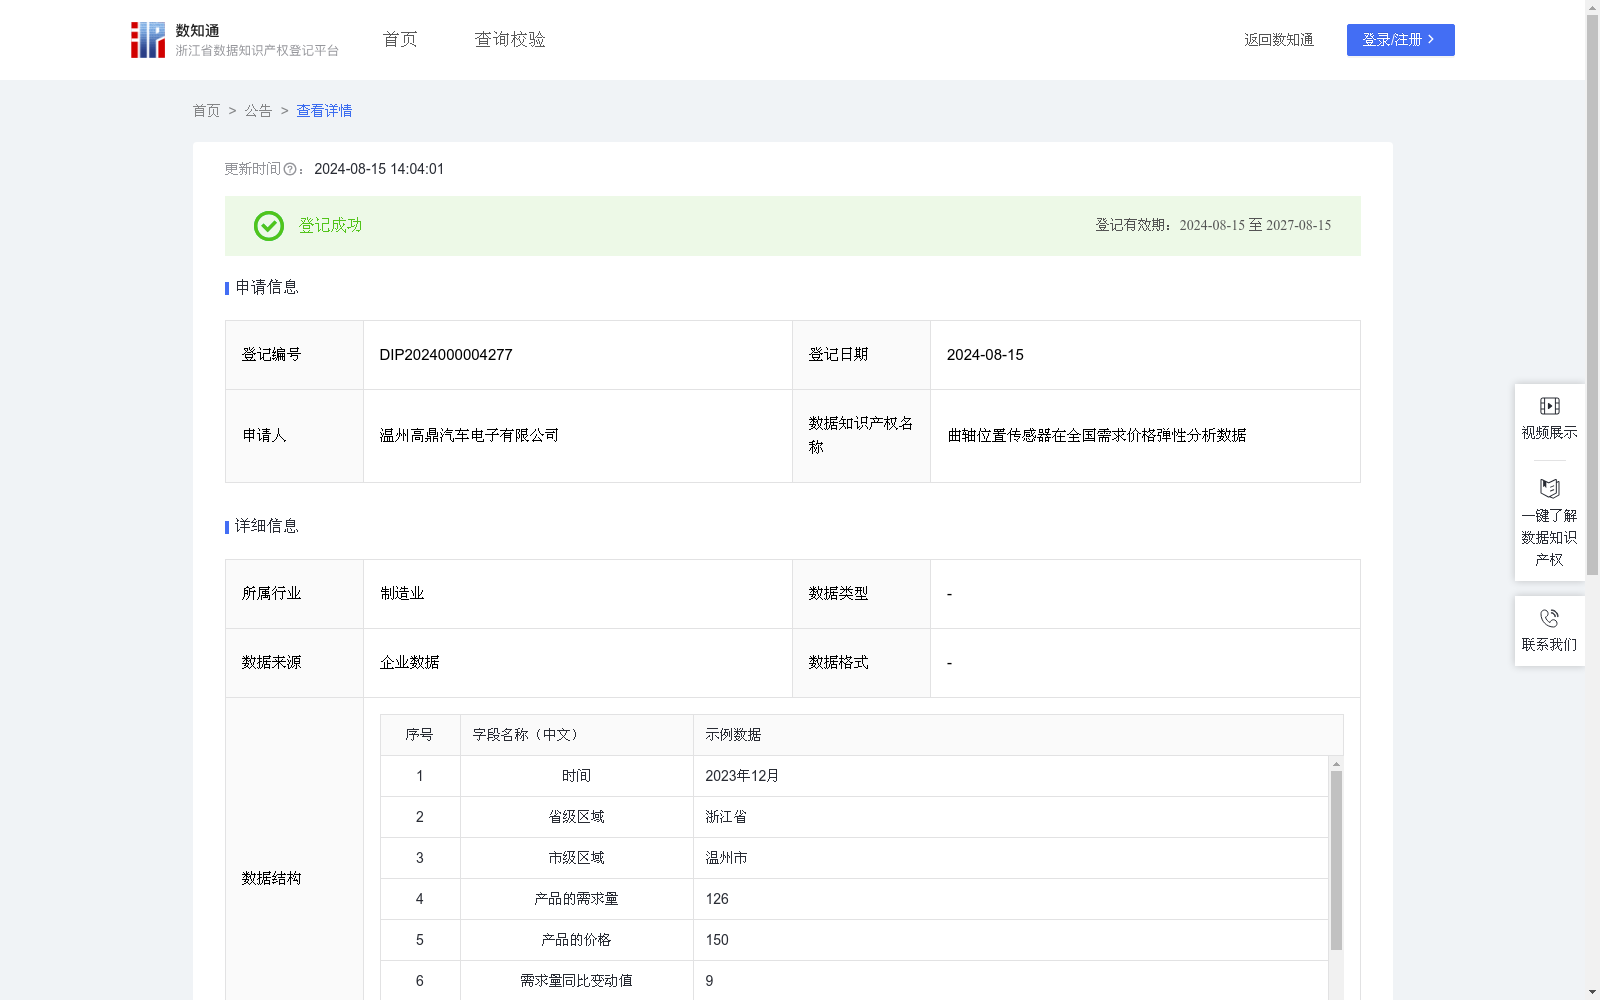
曲轴位置传感器在全国需求价格弹性分析数据
收藏资源简介:
为更好了解各市对曲轴位置传感器的市场需求情况,本行业所有企业对相关曲轴位置传感器需求弹性数据进行采集计算。如果曲轴位置传感器需求量变动的比率大于价格变动的比率,那么曲轴位置传感器需求富有弹性,说明顾客对于曲轴位置传感器价格变化的敏感程度大,弹性越大,需求对价格变化越敏感,本行业所有企业可以在该市适当的降低曲轴位置传感器价格来获得较多的收益。如果曲轴位置传感器需求缺乏弹性,本行业所有企业可以在该市适当的提高曲轴位置传感器价格来获得较多的收益。该项数据对本行业所有企业在全国的市场营销决策有重要意义。1.数据采集:采集相关曲轴位置传感器在某一时间段全国的的需求数据和价格数据,按照市级进行整理归纳,得到该曲轴位置传感器的需求量变动数值和价格变化数值。 2.算法规则:对采集得到的数据按照如下公式进行计算:需求弹性系数Ed=-(△Q/Q)÷(△P/P),得到需求弹性系数。式中:Q表示产品的需求量,单位为份;P表示产品的价格,单位为元;△Q表示需求量同比变动值,单位为份;△P表示价格同比变动值,单位为元。取需求弹性系数的绝对值|Ed|作为分析数据时的参考系数。 3.数据分析:根据|Ed|的数值可分析该曲轴位置传感器的需求价格弹性。(1)|Ed|=1(单位需求价格弹性),说明需求量变动幅度与价格变动幅度相同;(2)1<|Ed|(需求富有弹性),说明需求量变动幅度大于价格变动幅度;(3)|Ed|<1(需求缺乏弹性),说明需求量变动幅度小于价格变动幅度。
To better understand the market demand for crankshaft position sensors in various cities, all enterprises in this industry collected and calculated demand elasticity data for such sensors. If the percentage change in the quantity demanded of crankshaft position sensors exceeds the percentage change in their price, the demand for these sensors is price elastic, meaning customers are highly sensitive to price fluctuations of such sensors. The higher the elasticity, the more sensitive demand is to price changes. Under this circumstance, all enterprises in the industry can appropriately reduce the price of crankshaft position sensors in the target city to generate higher revenue. Conversely, if the demand for crankshaft position sensors is price inelastic, all enterprises in the industry can appropriately raise the price of these sensors in the target city to achieve greater revenue. This dataset holds significant importance for the marketing decision-making of all enterprises in this industry across the country. 1. Data Collection: Collect national demand and price data of relevant crankshaft position sensors over a specified time period, then organize and summarize the data by city to obtain the year-on-year changes in the quantity demanded and price of these sensors. 2. Algorithmic Rules: Calculate the demand elasticity coefficient using the following formula: $E_d = -(Delta Q/Q) div (Delta P/P)$. In this formula, $Q$ denotes the quantity demanded of the product (unit: units), $P$ denotes the product’s price (unit: yuan), $Delta Q$ represents the year-on-year change in quantity demanded (unit: units), and $Delta P$ represents the year-on-year change in price (unit: yuan). The absolute value of the demand elasticity coefficient $|E_d|$ is taken as the reference coefficient for data analysis. 3. Data Analysis: The price elasticity of demand for crankshaft position sensors can be analyzed based on the value of $|E_d|$: (1) $|E_d| = 1$ (Unitary Price Elasticity of Demand): Indicates that the magnitude of change in quantity demanded is identical to that in price; (2) $1 < |E_d|$ (Price Elastic Demand): Indicates that the magnitude of change in quantity demanded is greater than that in price; (3) $|E_d| < 1$ (Price Inelastic Demand): Indicates that the magnitude of change in quantity demanded is smaller than that in price.