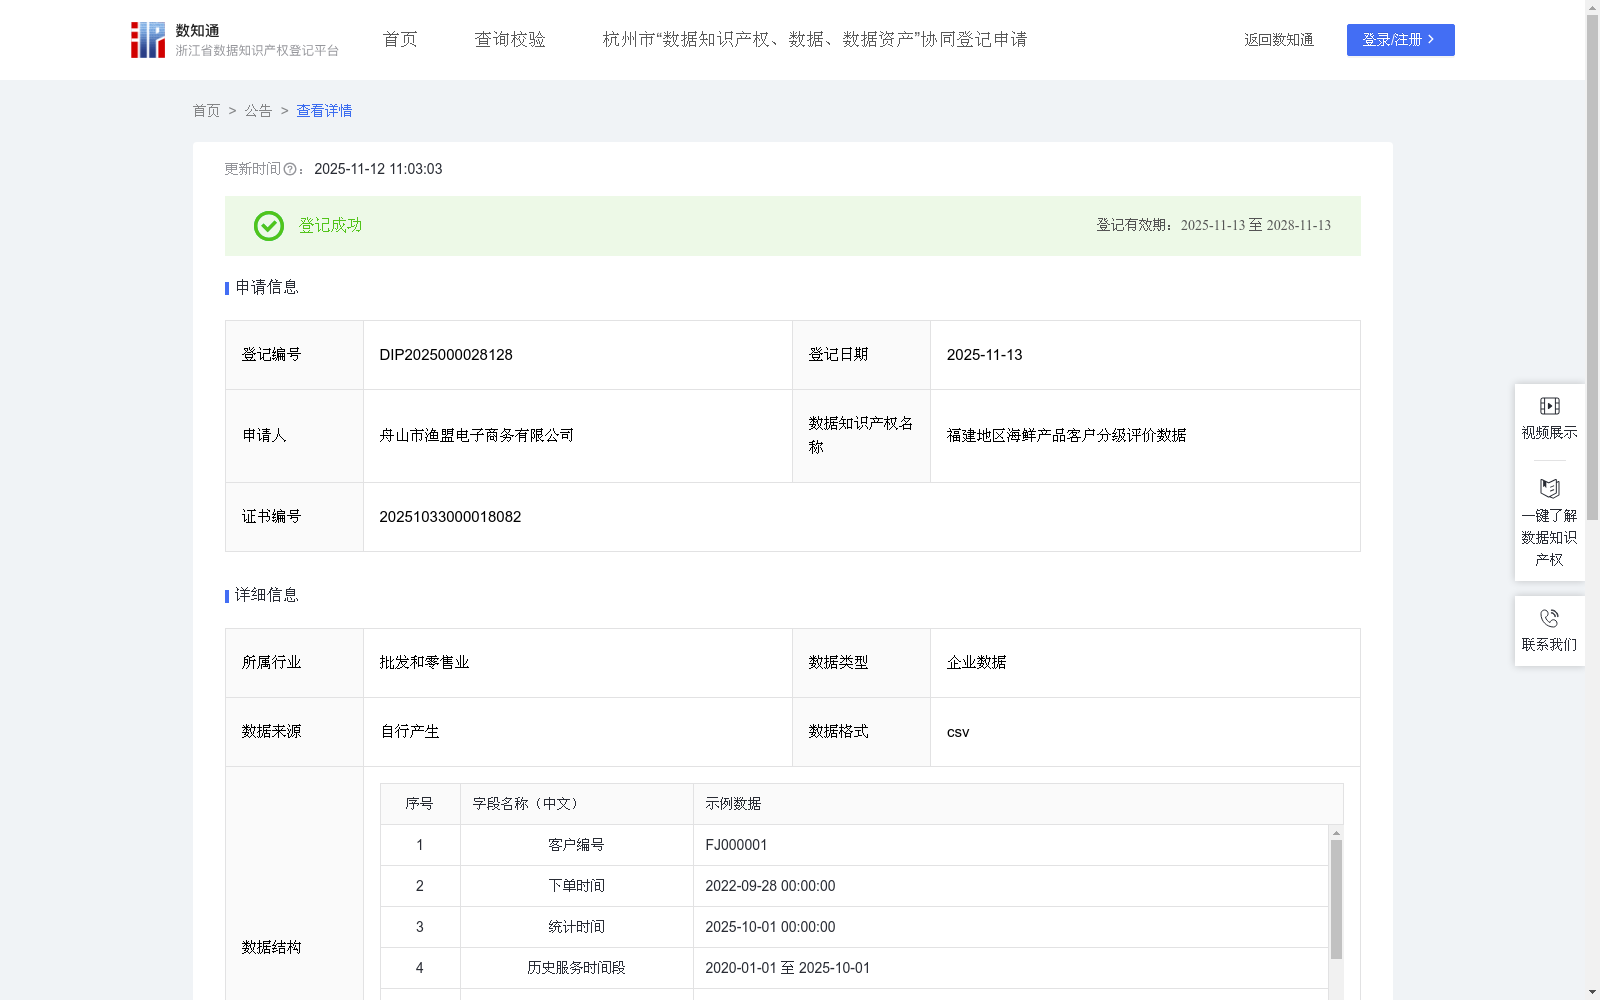
福建地区海鲜产品客户分级评价数据
收藏资源简介:
通过收集和分析福建省客户对海鲜产品的交易数据,运用RFM客户价值模型,对客户的购买力水平与消费偏好进行量化分析与等级划分,实现客户的精细化分层与精准化运营。通过对R(最近一次购买时间)、F(购买频率)和M(消费金额)三项指标的综合评估,系统可识别出高价值客户、中等价值客户与潜在客户群体,为企业提供差异化的客户管理策略支持。针对不同等级客户,可实施分层沟通与维护策略:对A级客户,每月保持1至2次重点沟通与回访,巩固合作关系、提升复购率;对B级客户,每季度进行1至2次沟通,关注其需求变化,促进持续购买;对C级客户,每半年沟通1至2次,通过活动或优惠提升其活跃度。此外,该分析模型还可为区域内客户群体高度重叠的相关企业提供个性化的数据支撑服务,帮助他们依据客户等级开展精准营销、产品推荐与客户价值提升管理。1. 数据采集: 采集福建地区客户对海鲜产品的相关交易数据。其中,采集数据中"下单时间"为距离统计时间最近的一次订单时间,"订单金额"指的是距离统计时间最近的这次订单金额,"区域"指的是客户所在的城市或省份,客户数据已进行脱敏转换处理。 2. 数据处理:对采集到的销售金额(元)、产品名称等数据进行分类、合并、累加,便于分析使用。其中客户编号已进行脱敏转换处理,销售区域按省份进行统计,时间数据统一转换为标准格式。 3. 算法加工:(1)R评分: 根据用户下单时间距离统计时间的天数(D)划分为5个等级: 0≤D≤7为5分;8≤D≤15为4分 ; 16≤D≤30为3分;31≤D≤60为2分;D>60为1分。 (2)F评分:消费频率评分根据历史购买总次数(S)划分为5个等级:S=1为1分; S=2为2分;3≤S≤4为3分;5≤S≤9为4分;S≥10为5分。(3)M评分:根据历史购买总金额(Z)划分为5个等级:Z<100元为1分;100≤Z<200元为2分;200≤Z<300元为3分;300≤Z<500元为4分;Z≥500元为5分;(4)RFM综合评分(X)=0.4×R+0.3×F+0.3×M。 (3)会员等级分为ABC三级:X≥4.0为A级(高价值客户);2.5≤X<4.0为B级(中等价值客户);X<2.5为C级(低价值客户)。
This dataset is constructed by collecting and analyzing seafood product transaction data from customers in Fujian Province, and adopting the RFM customer value model to quantitatively analyze and grade customers' purchasing power and consumption preferences, so as to achieve refined customer segmentation and precise operational management. Through the comprehensive evaluation of three core indicators: R (Recency, time since last purchase), F (Frequency, purchase frequency) and M (Monetary, total consumption amount), the system can identify high-value, medium-value and potential customer groups, providing support for enterprises to formulate differentiated customer management strategies. For customers of different grades, layered communication and maintenance strategies can be implemented: for Class A customers, conduct 1 to 2 key communications and return visits monthly to consolidate cooperative relationships and boost repurchase rates; for Class B customers, carry out 1 to 2 communications per quarter to track their demand changes and promote sustained purchases; for Class C customers, conduct 1 to 2 communications every six months to improve their activity via promotional activities or preferential offers. Additionally, this analysis model can offer personalized data support services for related enterprises with highly overlapping customer groups in the region, assisting them in launching precise marketing, product recommendation and customer value enhancement management based on customer grades. 1. Data Collection: Collect relevant transaction data of seafood products from customers in Fujian Province. Specifically, the "order placement time" in the collected data refers to the time of the most recent order relative to the statistical cutoff time, the "order amount" refers to the amount of that most recent order, and the "region" refers to the city or province where the customer is located. All customer data has undergone data desensitization processing. 2. Data Processing: Classify, merge and accumulate the collected data such as sales amount (in RMB) and product names to facilitate subsequent analysis. Among them, customer IDs have been processed via data desensitization, sales regions are counted at the provincial level, and all time data is uniformly converted to the standard format. 3. Algorithm Processing: (1) R Score: Divide the number of days (D) between the customer's order placement time and the statistical cutoff time into 5 tiers: 0 ≤ D ≤7: 5 points; 8 ≤ D ≤15: 4 points; 16 ≤ D ≤30: 3 points; 31 ≤ D ≤60: 2 points; D >60: 1 point. (2) F Score: The consumption frequency score is divided into 5 tiers based on the total number of historical purchases (S): S=1: 1 point; S=2: 2 points; 3 ≤ S ≤4: 3 points; 5 ≤ S ≤9: 4 points; S ≥10: 5 points. (3) M Score: Divide the total historical purchase amount (Z) into 5 tiers: Z < 100 RMB: 1 point; 100 ≤ Z <200 RMB: 2 points; 200 ≤ Z <300 RMB: 3 points; 300 ≤ Z <500 RMB: 4 points; Z ≥500 RMB: 5 points. (4) RFM Comprehensive Score (X) = 0.4×R + 0.3×F + 0.3×M. (5) Customer membership grades are divided into three tiers A, B and C: X ≥4.0: Class A (high-value customers); 2.5 ≤ X <4.0: Class B (medium-value customers); X <2.5: Class C (low-value customers).