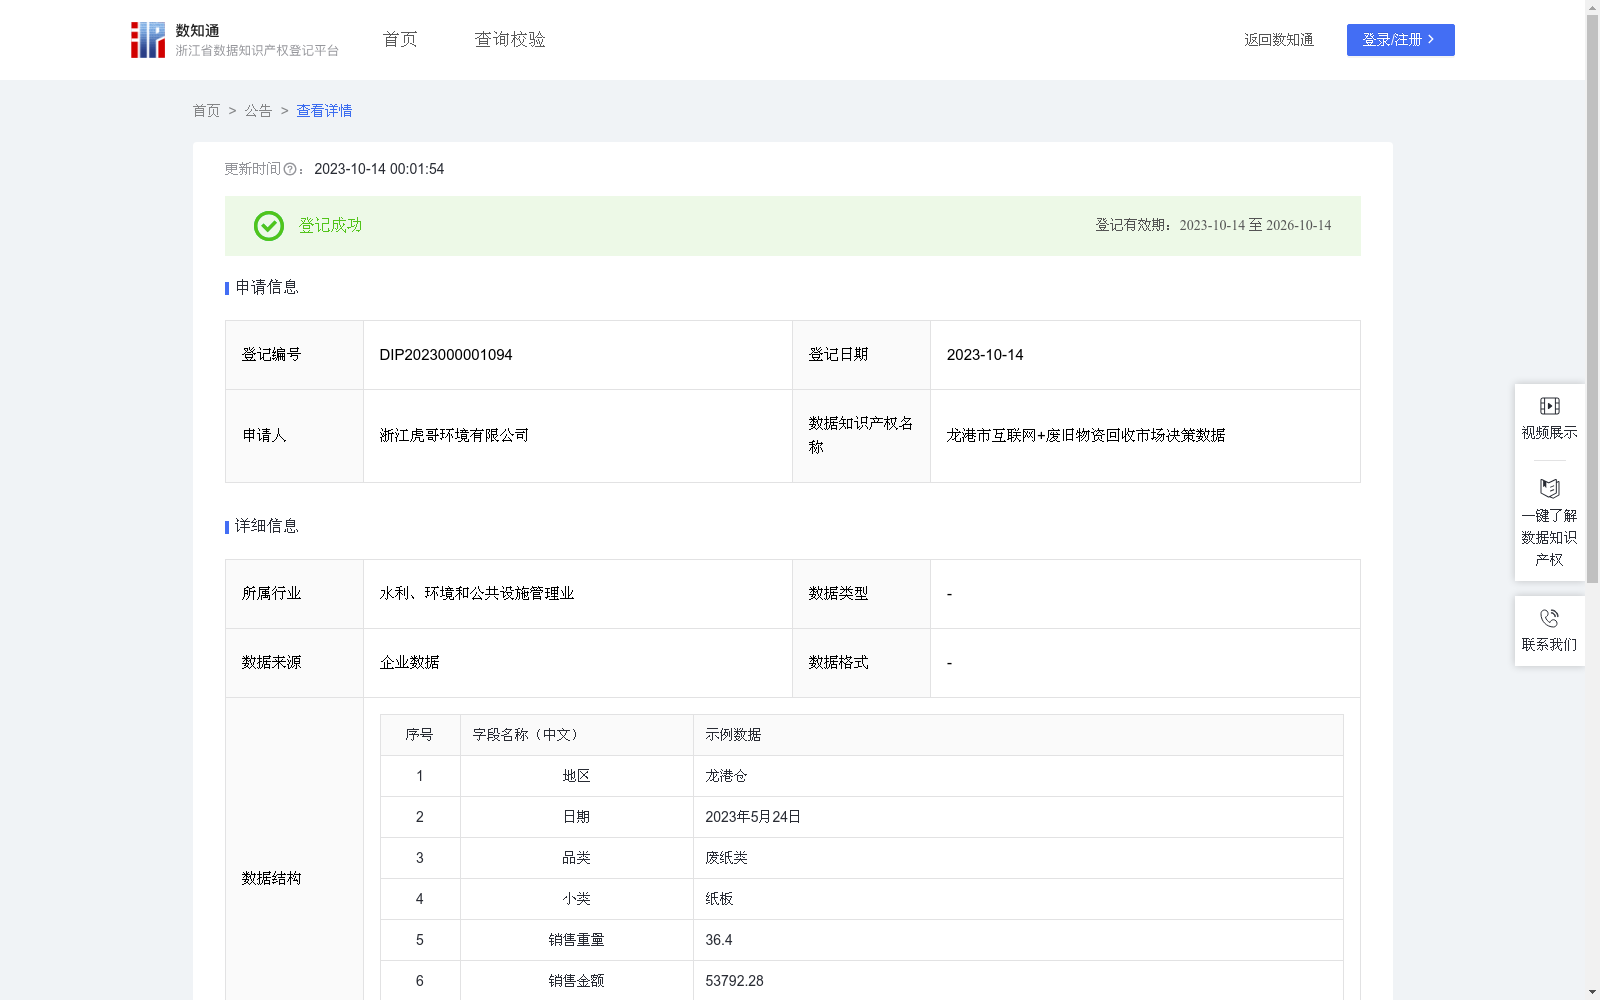
龙港市互联网+废旧物资回收市场决策数据
收藏浙江省数据知识产权登记平台2023-10-14 更新2024-05-08 收录
下载链接:
https://www.zjip.org.cn/home/announce/trends/5069
下载链接
链接失效反馈官方服务:
资源简介:
通过采集分析龙港市不同品类回收物品的销售重量,销售金额数据,分析各个品类的销售价格。能直观反应不同时段各个回收品类的价格走势,为垃圾回收市场,二次销售和采购提供可靠的分析指导依据。(1)数据采集:线下通过设备和手动录入的方式采集销售数据到数据库作为原始数据源。(2)数据处理:首先对采集销售数据进行清洗,包括销售金额为0的或者为null的。然后对销售数据在时间维度按日,品类维度按品类,小类维度按小类,进行最细级别粒度的聚合。(3)数据分析:按照公式:p = sum(O)/sum(w);其中o为每日小类销售金额;w为每日小类销售重量;p为销售均价;每天每个小类总销售金额,通过将每个订单的销售金额相加来实现;每天每个小类总销售重量,即该天内的订单总重量;使用上述公式,按照销售均价=每日销售小类销售金额/每日销售小类销售重量的算法进行统计分析。(4)数据应用:最后通过BI工具,按品类进行分类统计,利用折线图体现每个品类的历史价格走势情况。
This dataset collects and analyzes the sales weight and sales amount data of recycled items across different categories in Longgang City, to calculate the sales prices of each category. It can intuitively reflect the price trends of various recycled commodity categories across different time periods, providing reliable analytical guidance for the waste recycling market, secondary sales and procurement.
(1) Data Collection: Collect sales data into the database via offline equipment and manual entry as the original data source.
(2) Data Preprocessing: First, clean the collected sales data by removing entries with sales amount equal to 0 or null. Then, aggregate the sales data at the finest granularity: by day in the time dimension, by category in the category dimension, and by sub-category in the sub-category dimension.
(3) Data Analysis: Calculate using the formula: p = sum(O)/sum(w); where O represents the daily sales amount of the sub-category, w represents the daily sales weight of the sub-category, and p represents the average sales price. The total daily sales amount of each sub-category is obtained by summing the sales amount of every order; the total daily sales weight of each sub-category refers to the total order weight within that day. Statistical analysis is conducted following the algorithm that average sales price = total daily sales amount of the sub-category / total daily sales weight of the sub-category.
(4) Data Application: Finally, use BI tools to perform categorized statistics by category, and utilize line charts to visualize the historical price trends of each category.
提供机构:
浙江虎哥环境有限公司
创建时间:
2023-09-22
搜集汇总
数据集介绍
以上内容由遇见数据集搜集并总结生成


