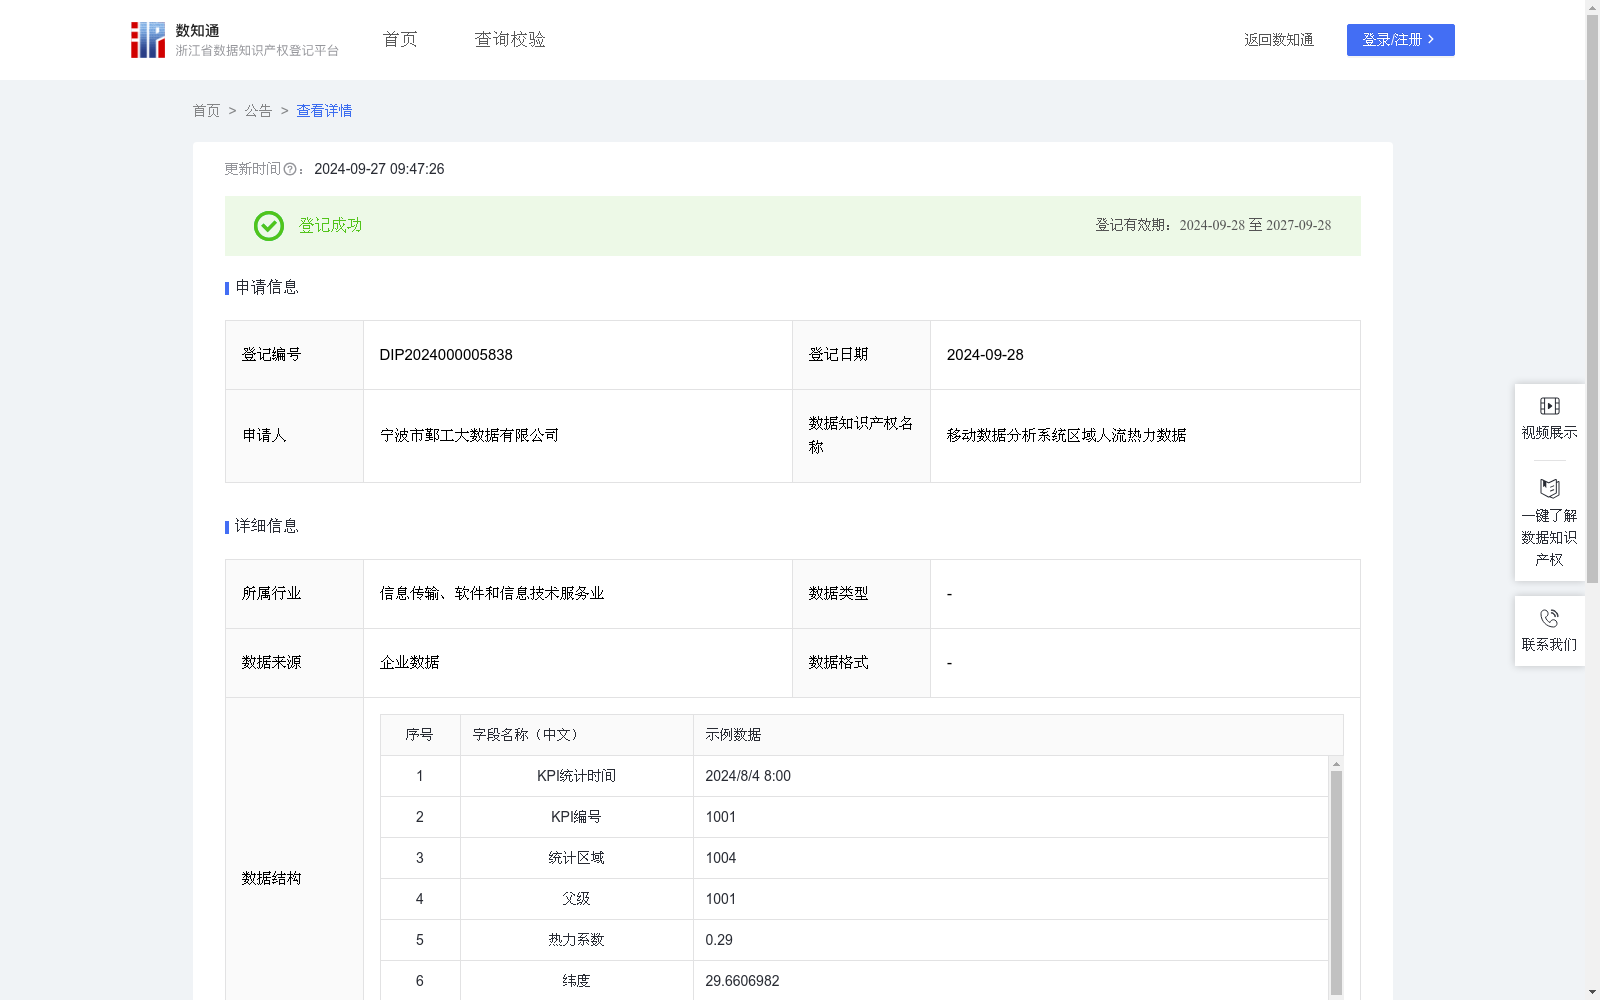
移动数据分析系统区域人流热力数据
收藏浙江省数据知识产权登记平台2024-09-27 更新2024-09-28 收录
下载链接:
https://www.zjip.org.cn/home/announce/trends/65731
下载链接
链接失效反馈官方服务:
资源简介:
该数据可以反馈出单位时间内,该区域的人流的密度和人流热点的分布情况,主要用于:
1、人口密度分布:通过显示城市各区域的人流热力程度,可以直观地了解人口分布的密集区域和稀疏区域,有助于城市规划者更好地进行城市布局和资源配置。
2、交通流量监控:热力图可以快速反映交通拥堵和畅通情况,帮助交通管理部门优化交通路线,缓解交通压力。
3、商圈分析:显示商业活动的热点区域,帮助商家了解商圈的活跃程度和商业发展潜力,从而做出更精准的营销决策。
4、经济发展情况:一般而言,热力图颜色越深,经济发展情况越好,这有助于政府了解各区域的经济发展状况,制定更合理的经济政策。
5、游客流量监控:景区可以通过人流热力图实时监测游客分布情况,及时调整游览路线和安保措施,确保游客安全。通过区域空间轮廓、基站位置比,筛选符合条件的原始信令数据,对数据进行去重、降噪处理,基于实时位置信令数据流处理集群运行客流模型,筛选符合驻留时间(KPI统计时间)的信令数据并进行拟合与数据扩样,通过对基站数据的经纬度(经度、纬度)、辅助以热力系数(当前点人数-最小点位人数)/(最大点位人数-最小点位人数),并通过网格数字编号(统计区域)的形式进行量化,从而提供汇聚后的区域客流指标数据,实现应用场景中的各种用途。
ps:由于平台最终以热力系数作为呈现方式,当前点人数与最小点人数均由移动创新院完成采集和计算,API接口只传送热力系数结果于数字分析平台数据库内。
This dataset reflects the pedestrian flow density and hotspot distribution within a given area per unit time, and is primarily applied in the following scenarios:
1. Population density distribution: By visualizing the pedestrian heat intensity across different urban zones, stakeholders can intuitively discern densely populated and sparsely populated areas, enabling urban planners to optimize urban layout and resource allocation more effectively.
2. Traffic flow monitoring: The heatmap can rapidly reflect traffic congestion and smooth traffic conditions, assisting traffic management authorities in optimizing traffic routes and mitigating traffic pressure.
3. Business district analysis: It identifies hotspot areas of commercial activities, helping merchants evaluate the activity level and development potential of business districts to make more targeted marketing decisions.
4. Economic development status: Generally, the darker the color of the heatmap, the more robust the local economic development, which enables governments to gain insights into the economic status of various regions and formulate more rational economic policies.
5. Tourist flow monitoring: Scenic spots can utilize the pedestrian heatmap to monitor tourist distribution in real time, adjust sightseeing routes and security measures promptly to ensure tourist safety.
The dataset is generated through the following workflow: First, filter eligible original signaling data based on regional spatial outlines and base station locations, then perform deduplication and noise reduction on the data. Next, run a passenger flow model on the real-time location signaling data stream processing cluster, screen the signaling data that meets the residence time (KPI statistical time) for fitting and data upsampling. Then, quantify the data using the longitude and latitude of base station data, supplemented by the heat coefficient formula: [(current point population - minimum point population) / (maximum point population - minimum point population)], and standardize the metrics using grid numbering (statistical area). Finally, output aggregated regional passenger flow indicator data to support various application scenarios mentioned above.
PS: Since the platform ultimately uses the heat coefficient as the presentation method, both the current point population and the minimum point population are collected and calculated by the Mobile Innovation Institute. The API interface only transmits the heat coefficient results to the database of the digital analysis platform.
提供机构:
宁波市鄞工大数据有限公司
创建时间:
2024-08-15
搜集汇总
数据集介绍
以上内容由遇见数据集搜集并总结生成


