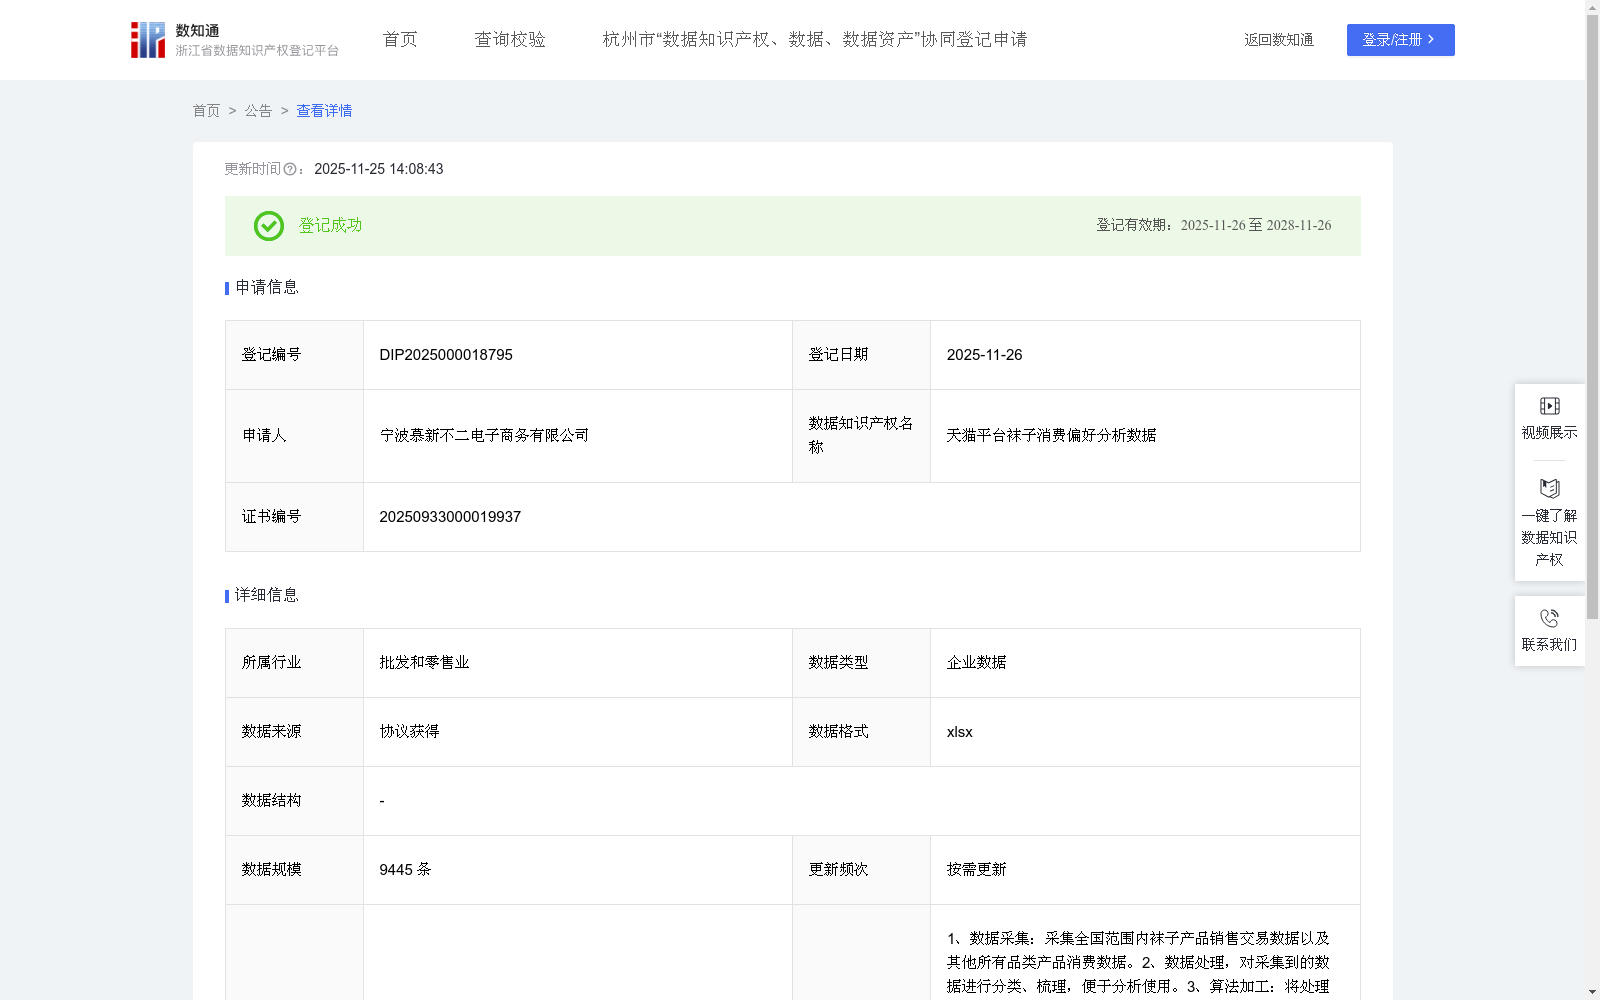
天猫平台袜子消费偏好分析数据
收藏浙江省数据知识产权登记平台2025-11-25 更新2025-11-26 收录
下载链接:
https://www.zjip.org.cn/home/announce/trends/8405773
下载链接
链接失效反馈官方服务:
资源简介:
通过收集和分析全国范围内有对袜子产品交易行为的省份以及相关消费数据,深度洞察天猫平台用户的消费偏好(如款式、材质、颜色、价格等),可应用于对公司内部运营的优化与重塑以及服装行业整体协同增强。对公司内部而言,对于高偏好品类,可以提前锁定优质面料供应商,优化采购成本,可灵活调整生产线,降低原材料和成品库存的资金占用,显著提升库存周转率。对于服装行业而言,可以行业协同共同开发更符合市场需求的新品,从源头优化产品设计,增强供应链条的响应速度与竞争力。从而为本行业的全链条企业制定生产销售策略提供数据支撑,更好地为客户提供个性化的商品和服务。1、数据采集:采集全国范围内袜子产品销售交易数据以及其他所有品类产品消费数据。2、数据处理,对采集到的数据进行分类、梳理,便于分析使用。3、算法加工:将处理后的数据进行分析:全品类产品平均订单金额=全品类产品销售额/全品类产品订单总数量(保留两位小数),偏好指数L(袜子)=(袜子销售额/全品类产品平均订单金额)*(全品类产品订单总数量/全品类产品销售额),用于将算法确定为基于全品类产品平均订单金额的需求量进行计算。数据为整理后状态,主要根据产品种类汇集,不完全按照时间先后顺序;订单可能存在捆绑/拼单/活动优惠,同品牌袜子产品单价在各区域、不同时间的差价忽略不计,因此全品类产品销售额/全品类产品订单总数量≠某品类产品销售额/某品类产品订单总数量,全品类数据由多个品类消费偏好数据集合汇总得出,依据行业经验采用全品类产品平均订单金额进行标准化算法处理。4、数据分类分级复用:根据计算出的偏好指数,L>5.0记为高偏好品类,1.0<L≤5.0记为中偏好品类,1.0≥L记为低偏好品类,根据等级安排更精准的生产营销策略,例如:加大高偏好品类的铺货量等。
This dataset is developed by collecting and analyzing socks product transaction data and relevant consumption data across all provinces in China, aiming to provide in-depth insights into consumer preferences (e.g., style, material, color, price, etc.) of Tmall platform users. The insights can be applied to optimize and restructure the company’s internal operations and enhance overall collaboration within the apparel industry.
For the company itself: For high-preference product categories, we can lock in high-quality fabric suppliers in advance to optimize procurement costs, flexibly adjust production lines, reduce capital tied up in raw material and finished product inventories, and significantly improve inventory turnover ratio. For the apparel industry: Industry collaboration can be promoted to jointly develop new products that better meet market demand, optimize product design from the source, and enhance the responsiveness and competitiveness of the supply chain. This will provide data support for enterprises across the entire industry chain to formulate production and sales strategies, so as to better deliver personalized products and services to customers.
1. Data Collection: Collect sales transaction data of socks products and consumption data of all other product categories across China.
2. Data Processing: Classify and organize the collected data to facilitate analysis and utilization.
3. Algorithm Processing: Analyze the processed data with the following formulas:
- Average Order Value of All Product Categories = Total Sales of All Product Categories / Total Number of Orders of All Product Categories (rounded to two decimal places)
- Preference Index L (Socks) = (Socks Sales / Average Order Value of All Product Categories) * (Total Number of Orders of All Product Categories / Total Sales of All Product Categories)
The algorithm is designed to calculate demand based on the average order value of all product categories. The data is in a consolidated state, mainly aggregated by product category, and not fully arranged in chronological order. Orders may involve bundling, group purchases, or promotional discounts, and price differences of the same-brand socks products across different regions and time periods are ignored. Therefore, Total Sales of All Product Categories / Total Number of Orders of All Product Categories ≠ Total Sales of a Specific Category / Total Number of Orders of the Specific Category. The all-category data is aggregated from consumption preference data of multiple product categories, and standardized algorithm processing using the average order value of all product categories is adopted based on industry experience.
4. Data Classification, Grading and Reuse: Based on the calculated preference index, product categories are divided into three levels:
- High-preference category: L > 5.0
- Medium-preference category: 1.0 < L ≤ 5.0
- Low-preference category: L ≤ 1.0
More precise production and marketing strategies will be formulated according to the category level, such as increasing the distribution volume of high-preference product categories, etc.
提供机构:
宁波慕新不二电子商务有限公司
创建时间:
2025-09-01
搜集汇总
数据集介绍
背景与挑战
背景概述
该数据集包含9445条企业数据,源自天猫平台的袜子消费交易,用于分析用户对袜子款式、材质、颜色和价格的偏好。通过计算偏好指数,帮助企业优化采购、生产和库存管理,并为服装行业提供数据支持以提升供应链响应和市场竞争力。
以上内容由遇见数据集搜集并总结生成


