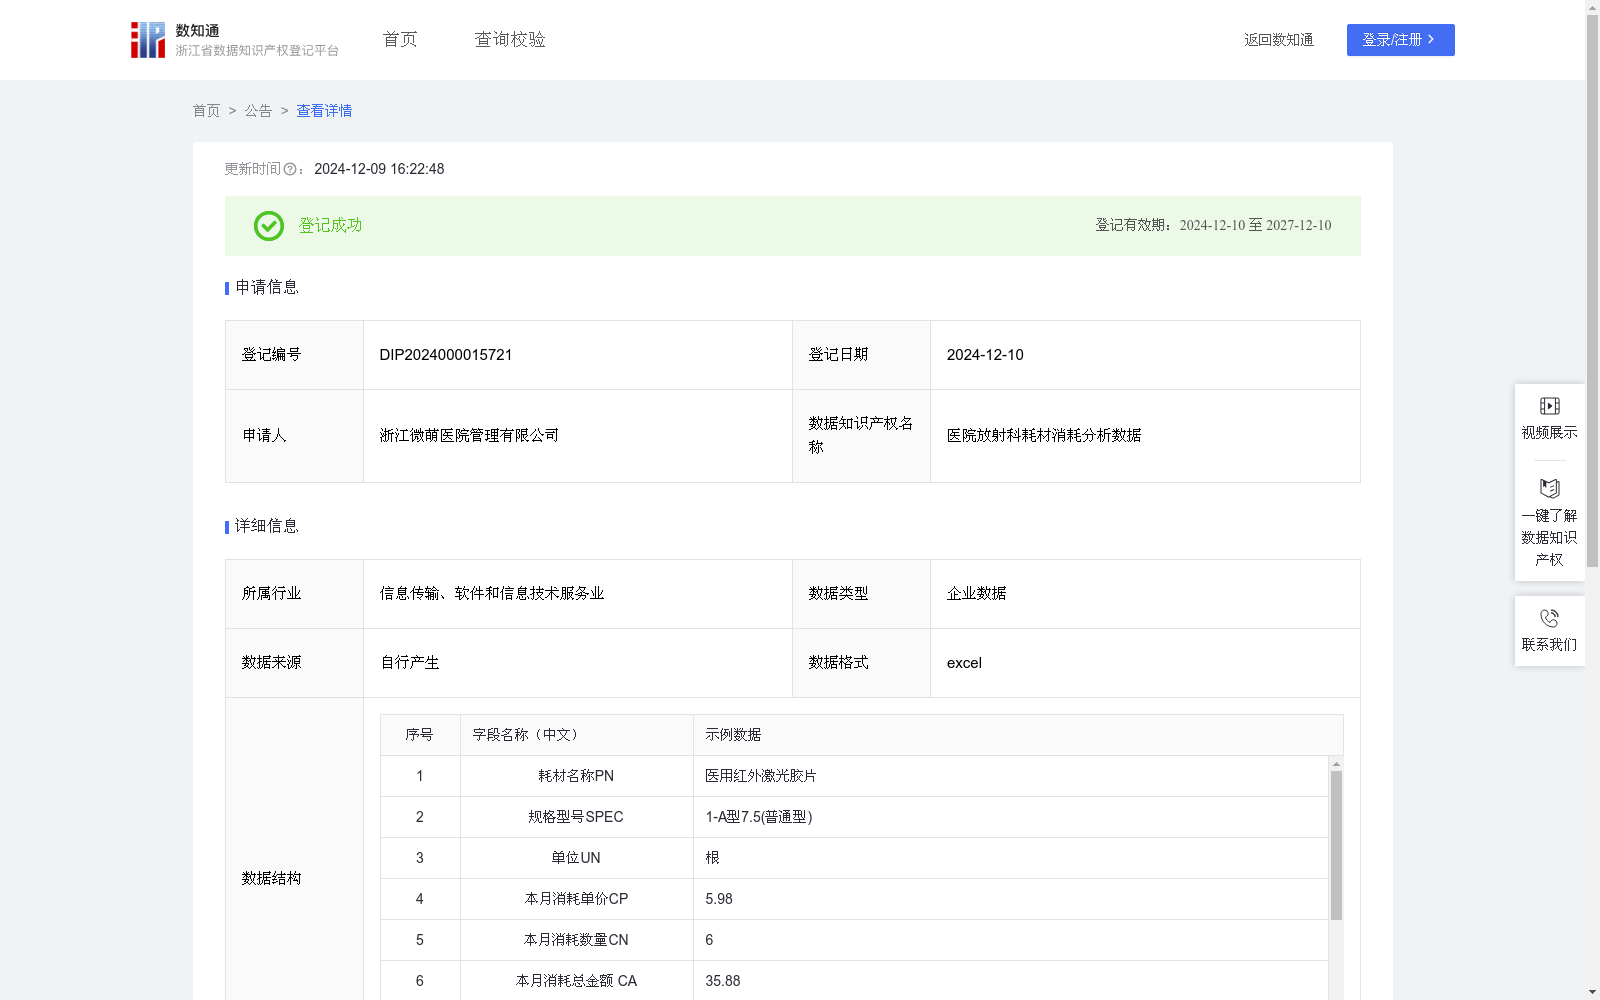
医院放射科耗材消耗分析数据
收藏资源简介:
在医院放射科耗材消耗分析场景中,通过对医院的放射科耗材消耗与时间维度的挖掘,生成的数据可作为模型辅助医院监管人员对医院放射科耗材消耗的异常波动分析.从而分析放射科耗材消耗的变化幅度与时间范围的关系.以此来管控放射科耗材消耗异常波动.定位问题,针对性的做介入管控和调节.该模型普适于各大医院和医疗机构.1:数据来源: 采集多个医院SPD系统中每月放射科耗材消耗数据,经系统算法加工而成。 2: 数据处理: 耗材名称: PN; 规格型号:SPEC; 单位: UN; 本月消耗单价: CP 当前月耗材消耗价格; 本月消耗数量 : CN 当前月耗材消耗数量 ; 本月消耗总金额 : CA 当前月耗材消耗总金额 ; 上月消耗单价: LP 上月的耗材消耗单价; 上月消耗数量: LN 上月的耗材消耗数量; 上月消耗总金额: LA 上月的耗材消耗总金额; 环比增长率: SGR 当前月耗材的消耗成本与上月的消耗成本的增长率; 环比增长率状态: SGRS 当前月耗材的消耗成本与上月的消耗成本的增长率状态; ; 消耗月份: MT; 3:算法分析: 采用公式计算该放射科耗材消耗环比增长率 SGR= ( (CP* CN )/(LP*LN)-1) x100%; 4:数据应用: 在医院放射科耗材消耗分析场景中,该放射科耗材消耗环比增长率SGR( 小于-60%,当月该放射科耗材消耗异常,(-60% 100%),正常浮动范围, 大于100%当月该放射科耗材消耗异常 );
In the scenario of hospital radiology consumables consumption analysis, the data generated by mining hospital radiology consumables consumption data across time dimensions can be used to develop a model that assists hospital supervisors in analyzing abnormal fluctuations of radiology consumables consumption, explore the relationship between the fluctuation range of consumables consumption and time span, control abnormal fluctuations of radiology consumables consumption, identify underlying problems, and implement targeted intervention and adjustment. This model is universally applicable to all major hospitals and medical institutions. 1. Data Source: The dataset is compiled from monthly radiology consumables consumption data collected from the SPD systems of multiple hospitals, after being processed via systematic algorithms. 2. Data Processing: Consumables Name: PN; Specification & Model: SPEC; Unit: UN; Current Month Unit Price: CP, representing the unit price of consumables consumption in the current month; Current Month Consumption Quantity: CN, representing the consumption quantity of consumables in the current month; Current Month Total Consumption Amount: CA, representing the total consumption amount of consumables in the current month; Previous Month Unit Price: LP, representing the unit price of consumables consumption in the previous month; Previous Month Consumption Quantity: LN, representing the consumption quantity of consumables in the previous month; Previous Month Total Consumption Amount: LA, representing the total consumption amount of consumables in the previous month; Month-on-Month Growth Rate: SGR, representing the growth rate of consumables consumption cost between the current month and the previous month; Month-on-Month Growth Rate Status: SGRS, representing the status of the month-on-month growth rate of consumables consumption cost between the current month and the previous month; Consumption Month: MT; 3. Algorithm Analysis: The month-on-month growth rate SGR of radiology consumables consumption is calculated using the following formula: SGR = ((CP * CN) / (LP * LN) - 1) * 100%; 4. Data Application: In the scenario of hospital radiology consumables consumption analysis, the month-on-month growth rate SGR of radiology consumables consumption is used to identify abnormal consumption as follows: - When SGR < -60%: Abnormal consumption of radiology consumables in the current month; - When -60% ≤ SGR ≤ 100%: Within the normal fluctuation range; - When SGR > 100%: Abnormal consumption of radiology consumables in the current month;