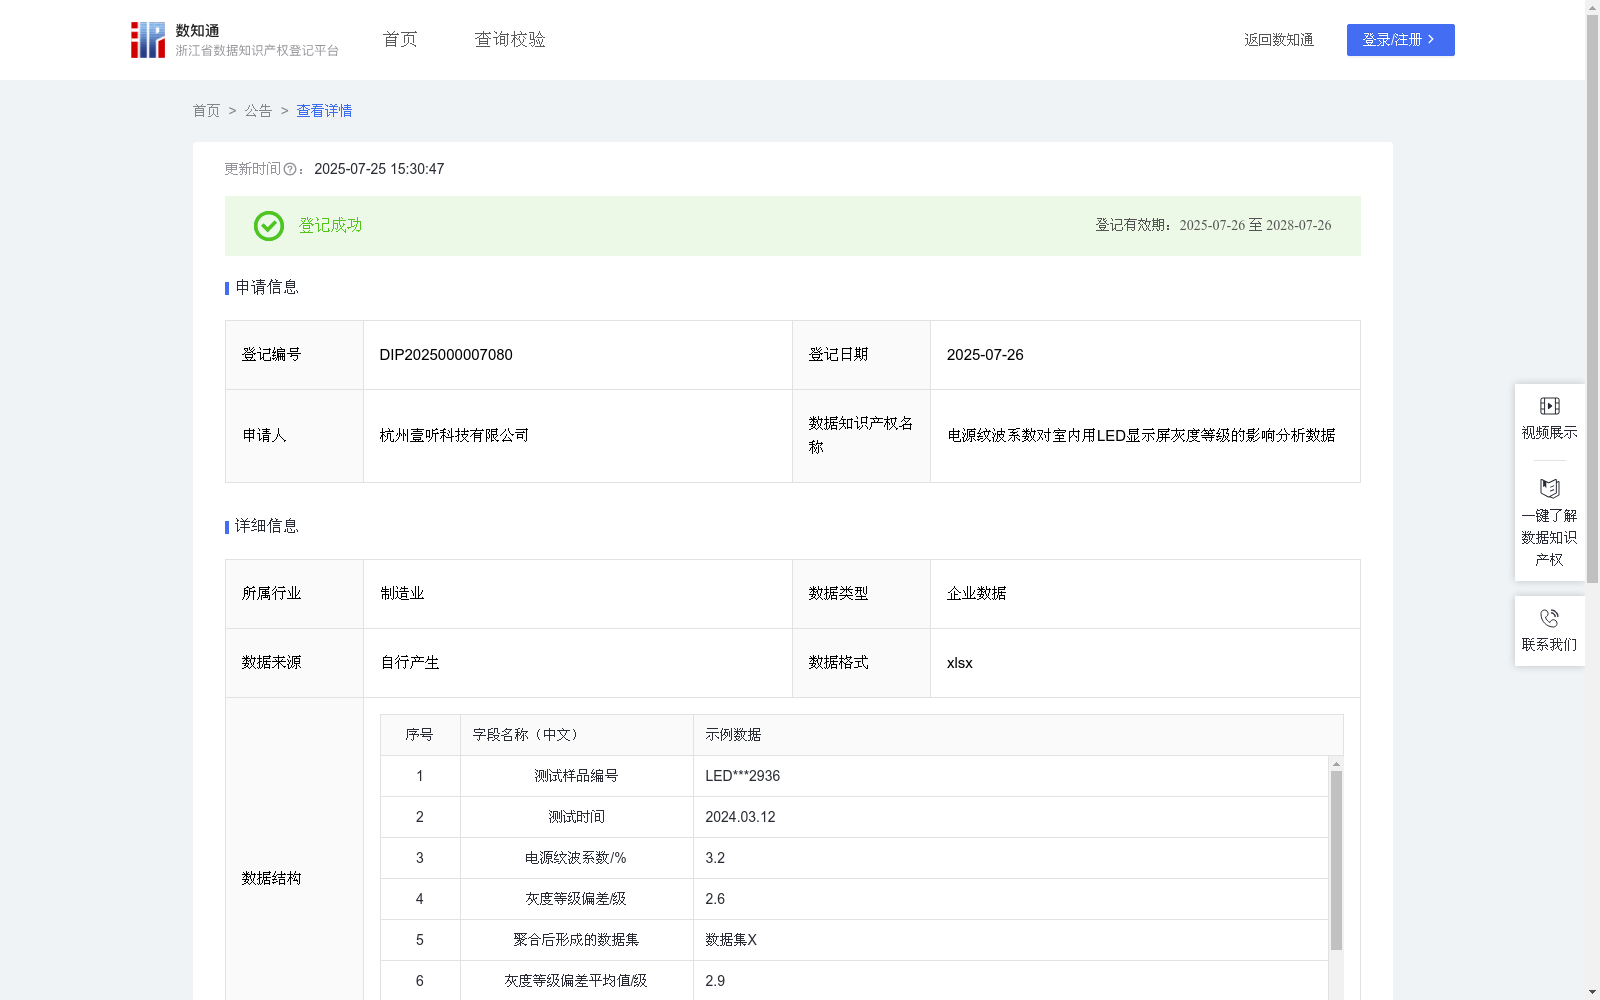
电源纹波系数对室内用LED显示屏灰度等级的影响分析数据
收藏浙江省数据知识产权登记平台2025-07-25 更新2025-07-26 收录
下载链接:
https://www.zjip.org.cn/home/announce/trends/154880
下载链接
链接失效反馈官方服务:
资源简介:
本数据聚焦于分析电源纹波系数对室内用LED显示屏灰度等级的影响,揭示了电源质量与显示屏色彩还原能力之间的量化关系,为电源系统设计及显示屏供电方案优化提供了重要依据。具体体现在以下方面:
1.优化电源设计方案:通过分析纹波系数对灰度等级的影响,厂商可科学确定电源滤波参数,平衡电源性能与成本。
2.指导供电系统选型:本数据可供电源工程师、显示系统设计师及质检人员使用,为其制定电源质量标准、优化供电方案、评估系统性能等工作提供数据支持。1.数据采集:
系统记录不同电源纹波系数下的LED显示屏灰度等级偏差测试数据,包括测试样品编号、测试时间、电源纹波系数/%、灰度等级偏差/级等字段。
2.数据预处理:
(1)对采集的数据进行有效性验证,剔除异常数据。
(2)将历史数据与当前测试数据聚合,形成数据集X,并计算灰度等级偏差的平均值。
3.计算线性回归斜率a和截距b:
(1)基于数据集X(以电源纹波系数为自变量、灰度等级偏差为因变量),运用回归分析确定斜率a和截距b。
(2)斜率a表示纹波系数每增加1%对灰度等级偏差的影响程度,截距b表示理论基准值。
4.结果运用:
(1)计算比例系数k:k=|a/灰度等级偏差平均值|×100%。
(2)若k≥10%,则判定为"高影响",若5%≤k<10%,则判定为"中影响",若k<5%,则判定为"低影响"。
This dataset focuses on analyzing the impact of power supply ripple coefficients on the grayscale levels of indoor LED displays, revealing the quantitative relationship between power supply quality and the color reproduction capability of displays, and providing an important basis for power system design and the optimization of display power supply schemes. The specific applications are reflected in the following aspects:
1. Optimize power supply design schemes: By analyzing the impact of ripple coefficients on grayscale levels, manufacturers can scientifically determine power supply filtering parameters to balance power performance and cost.
2. Guide power supply system selection: This dataset can be used by power supply engineers, display system designers and quality inspection personnel, providing data support for their work such as formulating power supply quality standards, optimizing power supply schemes and evaluating system performance.
1. Data collection:
The system records test data of grayscale level deviations of LED displays under different power supply ripple coefficients, including fields such as test sample number, test time, power supply ripple coefficient (%), and grayscale level deviation (level).
2. Data preprocessing:
(1) Perform validity verification on the collected data and eliminate abnormal data.
(2) Aggregate historical data and current test data to form dataset X, and calculate the average value of grayscale level deviations.
3. Calculate linear regression slope a and intercept b:
(1) Based on dataset X (taking power supply ripple coefficient as the independent variable and grayscale level deviation as the dependent variable), regression analysis is used to determine slope a and intercept b.
(2) Slope a represents the degree of impact on grayscale level deviation when the ripple coefficient increases by 1%, while intercept b represents the theoretical baseline value.
4. Application of results:
(1) Calculate the proportional coefficient k: k = |a / average grayscale level deviation| × 100%.
(2) If k ≥ 10%, it is judged as "high impact"; if 5% ≤ k < 10%, it is judged as "medium impact"; if k < 5%, it is judged as "low impact".
提供机构:
杭州壹听科技有限公司
创建时间:
2025-06-06
搜集汇总
数据集介绍
背景与挑战
背景概述
该数据集聚焦于分析电源纹波系数对室内用LED显示屏灰度等级的影响,揭示了电源质量与显示屏色彩还原能力之间的量化关系。数据集包含682条记录,通过回归分析计算比例系数k,为电源系统设计及显示屏供电方案优化提供重要依据。
以上内容由遇见数据集搜集并总结生成


