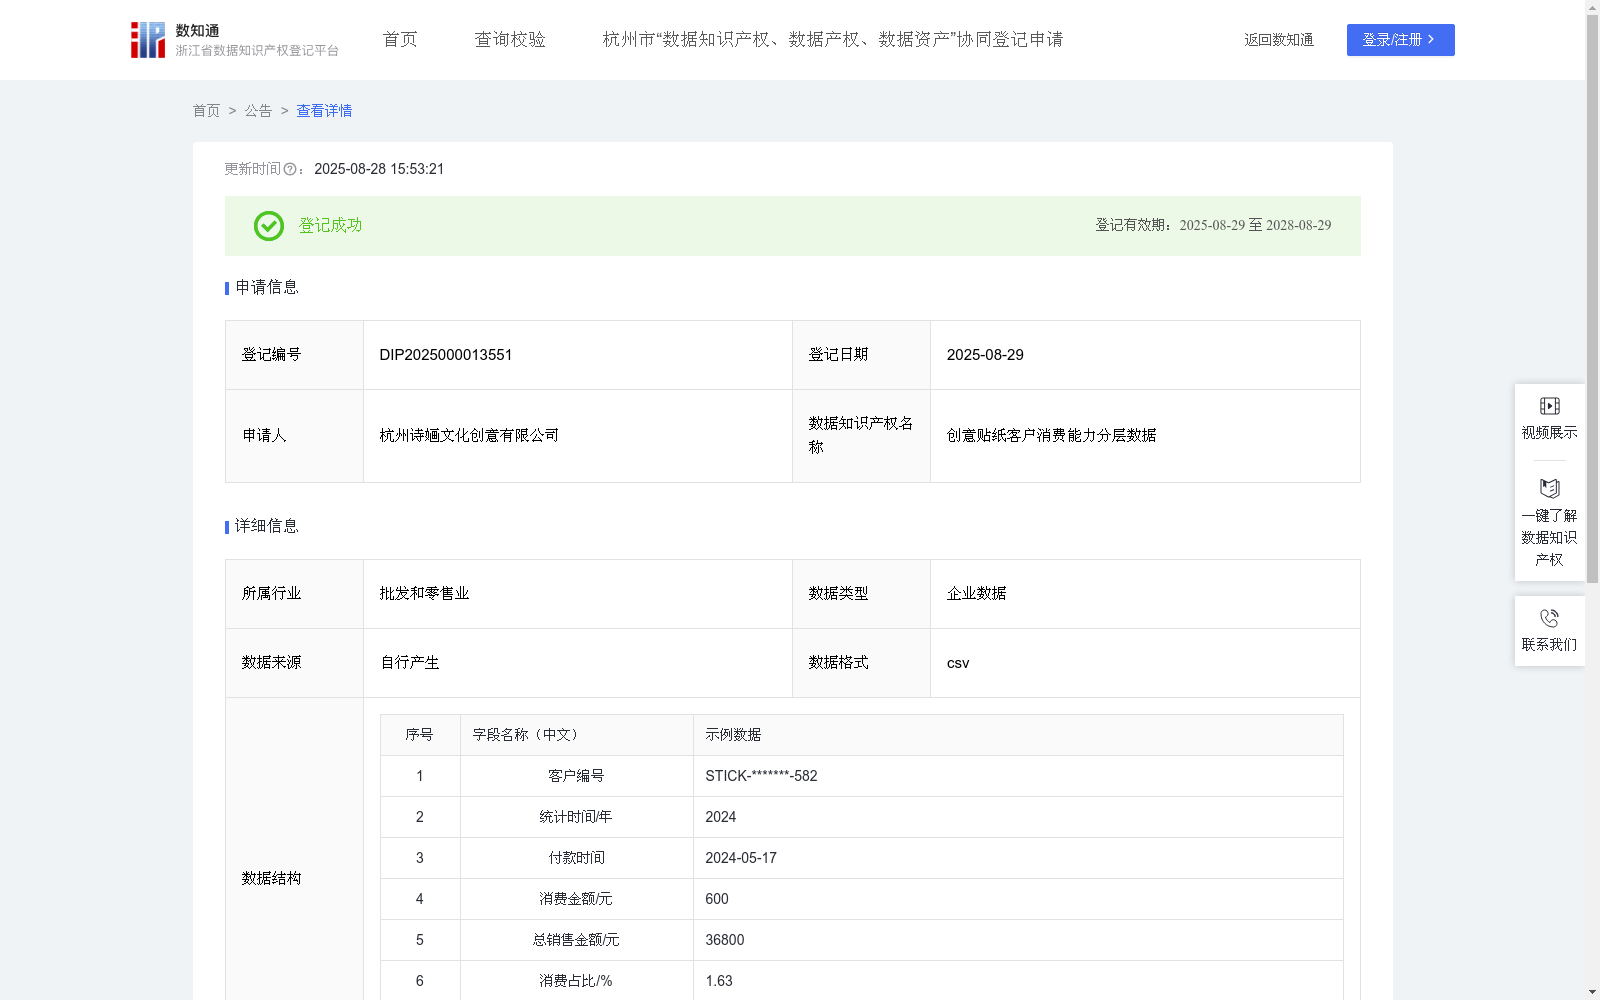
创意贴纸客户消费能力分层数据
收藏资源简介:
本数据通过对创意贴纸客户的购买行为与使用特征进行分析,建立客户消费能力分层模型,识别不同客户在购买频次、产品品类偏好及复购稳定性方面的差异。在此基础上,进一步掌握不同层级客户在消费习惯、风格偏好与服务期望等方面的特征。基于该分层数据,为文创品牌商、电商平台及相关供应商提供差异化的产品组合建议与服务优化方案,更精准地满足客户多样化的消费需求,提升客户满意度与品牌粘性,增强用户活跃度与市场竞争力。1.数据收集:收集购买创意贴纸客户的消费数据,根据客户消费能力梳理数据,具体包括:客户编号、统计时间/年、付款时间、消费金额/元等字段。 2.总销售金额计算:用Group函数以统计时间为分组,计算每年的销售总金额。总销售金额=SUM(每条数据的消费金额字段)。 3.消费占比计算:消费占比=消费金额 / 总销售金额 * 100%。 4.消费占比降序排列,运用ABCDEF分类法: 消费占比≥1%,给予“A类消费”分层; 1%≥消费占比≥0.8%,给予“B类消费”分层; 0.8%≥消费占比≥0.6%,给予“C类消费”分层; 0.6%≥消费占比≥0.4%,给予“D类消费”分层; 0.4%≥消费占比≥0.2%,给予“E类消费”分层; 0.2%≥消费占比,给予“F类消费”分层。 3、数据应用:通过这样的分析流程,企业不仅能够更准确地把握市场动态,还能够有效提升客户满意度和市场竞争力。
This dataset analyzes the purchase behavior and usage characteristics of customers purchasing creative sticker products, establishes a customer consumption capability stratification model, and identifies the differences among different customer groups in terms of purchase frequency, product category preference and repurchase stability. On this basis, it further grasps the characteristics of customers at different tiers in terms of consumption habits, style preferences and service expectations. Based on the stratified data, it provides differentiated product portfolio recommendations and service optimization plans for cultural and creative brand merchants, e-commerce platforms and relevant suppliers, so as to more accurately meet the diversified consumption demands of customers, improve customer satisfaction and brand stickiness, and enhance user activity and market competitiveness. 1. Data Collection: Collect consumption data of customers who purchase creative stickers, and organize the data based on customer consumption capability. The specific fields include: customer ID, statistical time/year, payment time, consumption amount (yuan), etc. 2. Total Sales Amount Calculation: Use the Group function with statistical time as the grouping basis to calculate the annual total sales amount. The formula is: Total Sales Amount = SUM (consumption amount field of each record). 3. Consumption Proportion Calculation: Consumption Proportion = (Consumption Amount / Total Sales Amount) * 100%. 4. Sort in descending order of consumption proportion, and apply the ABCDEF classification method: - For consumption proportion ≥ 1%, classify it as "Class A Consumption"; - For 1% ≥ Consumption proportion ≥ 0.8%, classify it as "Class B Consumption"; - For 0.8% ≥ Consumption proportion ≥ 0.6%, classify it as "Class C Consumption"; - For 0.6% ≥ Consumption proportion ≥ 0.4%, classify it as "Class D Consumption"; - For 0.4% ≥ Consumption proportion ≥ 0.2%, classify it as "Class E Consumption"; - For Consumption proportion ≤ 0.2%, classify it as "Class F Consumption". 3. Data Application: Through such an analysis workflow, enterprises can not only accurately grasp market dynamics, but also effectively improve customer satisfaction and market competitiveness.