five

IPUMS USA|人口普查数据集|社会经济分析数据集

收藏
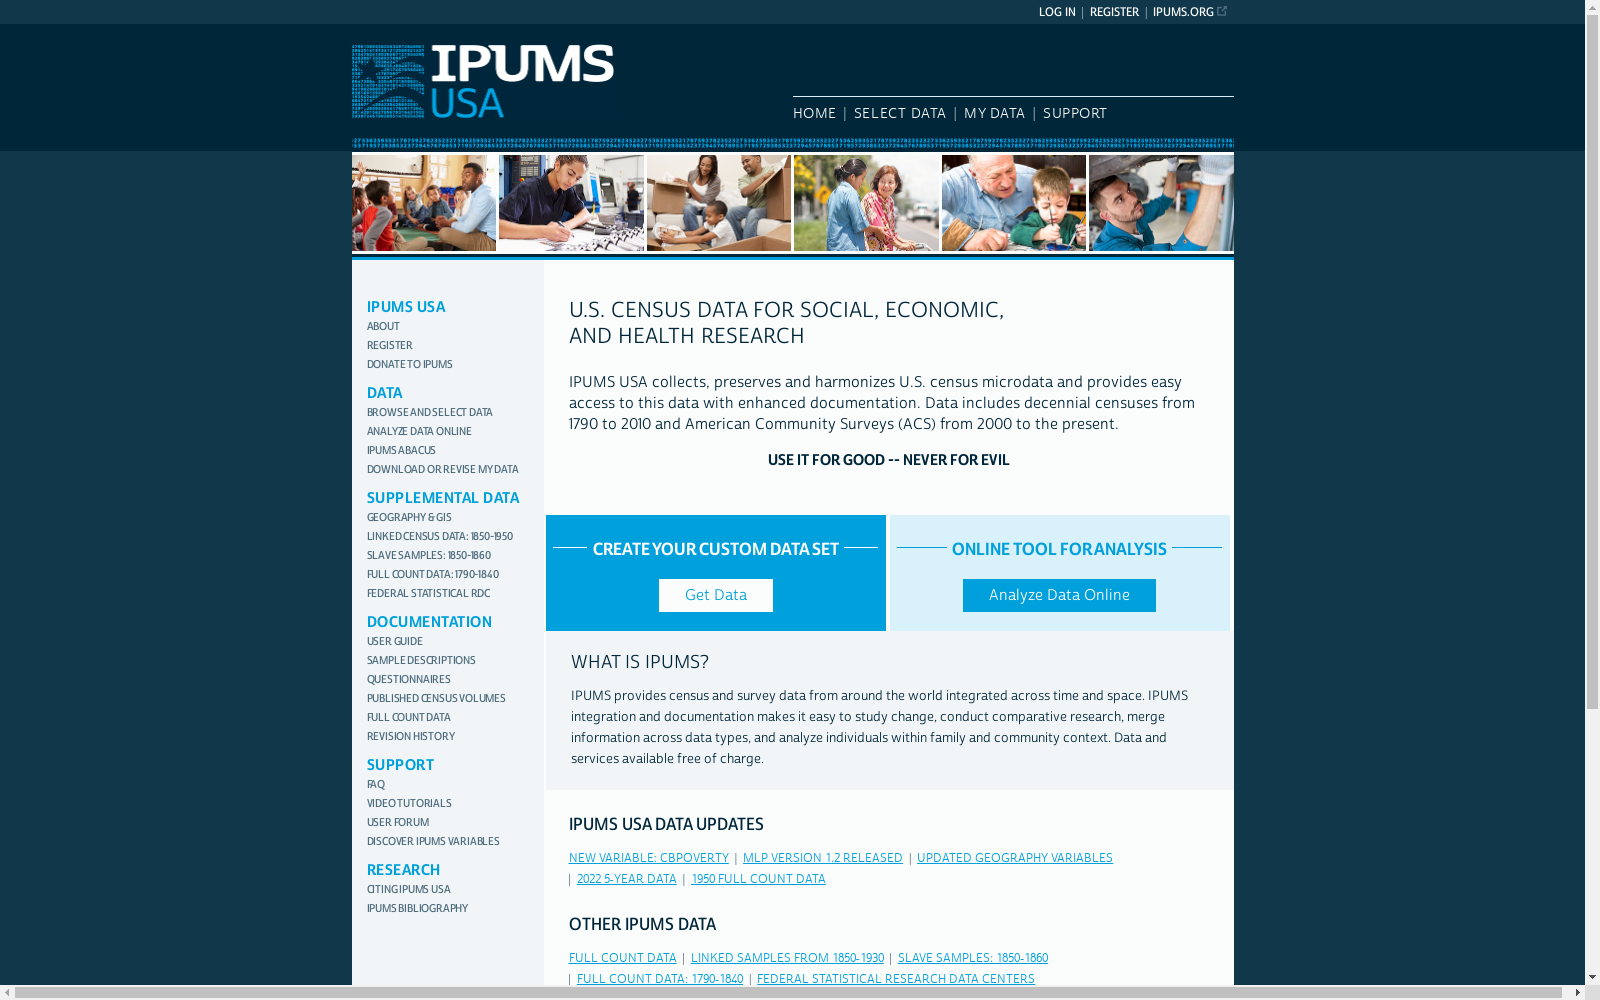
usa.ipums.org2024-10-25 收录
人口普查
社会经济分析
下载链接:
https://usa.ipums.org/
下载链接
链接失效反馈
资源简介:
IPUMS USA 是一个综合性的美国人口普查数据集,包含了从1850年至今的美国人口普查数据。该数据集提供了详细的个体和家庭层面的社会经济信息,包括人口统计、教育、就业、收入、住房等多个方面。数据经过标准化处理,便于跨时间和空间进行比较分析。
提供机构:
usa.ipums.org
AI搜集汇总
数据集介绍
main_image_url
构建方式
IPUMS USA数据集的构建基于美国人口普查局提供的原始人口普查数据,通过一系列严格的数据清洗和标准化处理流程。首先,原始数据经过去重和缺失值填补,确保数据的完整性和准确性。随后,数据被分类和编码,以适应统一的数据格式。最后,通过多层次的质量控制机制,确保数据集的高质量和一致性。
特点
IPUMS USA数据集以其全面性和标准化著称,涵盖了美国自1850年以来的多次人口普查数据。该数据集不仅包括人口统计信息,还涵盖了经济、社会和地理等多维度数据。其特点在于数据的长期连续性和高度的可比性,使得研究者能够进行跨时间和跨区域的深入分析。此外,数据集的开放获取政策也促进了学术研究和政策分析的广泛应用。
使用方法
使用IPUMS USA数据集时,研究者首先需注册并获取访问权限。随后,通过在线平台或下载数据文件,研究者可以根据研究需求选择特定的变量和样本。数据集提供了详细的使用指南和代码本,帮助用户理解和处理数据。在分析过程中,研究者可以利用统计软件如R或Stata进行数据处理和建模,以探索人口变化、社会经济趋势等复杂议题。
背景与挑战
背景概述
IPUMS USA(Integrated Public Use Microdata Series, USA)是由明尼苏达大学人口中心开发的一个综合性微观数据集,旨在提供美国人口普查数据的详细记录。自1960年以来,IPUMS USA收集并整合了美国历次人口普查的微观数据,涵盖了人口、经济、社会等多个方面的信息。这一数据集的创建极大地促进了社会科学、经济学和人口学等领域的研究,使得学者们能够进行更为精细和深入的分析。通过标准化处理,IPUMS USA消除了不同年份数据之间的格式差异,为跨时间研究提供了便利。
当前挑战
尽管IPUMS USA在数据整合和标准化方面取得了显著成就,但其构建过程中仍面临诸多挑战。首先,数据隐私保护是一个重要问题,如何在提供详细数据的同时确保个人隐私不被泄露,是IPUMS USA必须解决的难题。其次,数据质量的保证也是一个持续的挑战,包括数据录入错误、缺失值处理以及不同年份数据的一致性问题。此外,随着数据量的增加,如何高效地存储和检索数据,以及如何处理大规模数据分析中的计算复杂性,也是IPUMS USA需要不断优化的方面。
发展历史
创建时间与更新
IPUMS USA数据集由明尼苏达大学人口中心于1997年创建,旨在整合和标准化美国人口普查数据。自创建以来,该数据集已多次更新,最近一次重大更新是在2021年,涵盖了2020年美国人口普查的数据。
重要里程碑
IPUMS USA的首次发布标志着人口普查数据处理和分析方式的重大变革,其标准化和整合功能极大地提高了数据的可访问性和可用性。2000年,该数据集扩展至包括1850年以来的所有美国人口普查数据,成为历史和当代人口研究的重要资源。2010年,IPUMS USA引入了地理编码和空间分析工具,进一步增强了其在社会科学研究中的应用。
当前发展情况
当前,IPUMS USA已成为全球社会科学研究中不可或缺的工具,其数据被广泛应用于经济学、社会学、历史学等多个领域。通过持续更新和扩展,IPUMS USA不仅提供了最新的普查数据,还保留了历史数据,为跨时间研究提供了宝贵的资源。此外,IPUMS USA的在线平台和用户友好的界面,使得数据访问和分析变得更加便捷,极大地推动了相关领域的研究进展。
发展历程
  • IPUMS USA首次发布,由明尼苏达大学人口中心创建,旨在整合和标准化美国人口普查数据。
    1997年
  • IPUMS USA增加了1990年美国人口普查的数据,进一步丰富了数据集的内容。
    2000年
  • 数据集扩展至包括2000年美国人口普查的数据,提升了其在社会科学研究中的应用价值。
    2004年
  • IPUMS USA引入了2010年美国人口普查的数据,继续保持其作为重要社会经济研究工具的地位。
    2010年
  • 数据集更新至包括2017年美国社区调查的数据,增强了其在微观数据分析中的实用性。
    2018年
常用场景
经典使用场景
IPUMS USA数据集在社会科学研究中占据重要地位,其经典使用场景包括人口统计学分析、社会经济状况评估以及政策效果评估。研究者利用该数据集进行长期趋势分析,揭示美国人口结构的变化及其对社会经济的影响。例如,通过分析不同年份的IPUMS USA数据,学者们能够追踪教育水平、收入分布和职业结构的变化,从而为政策制定提供科学依据。
衍生相关工作
IPUMS USA数据集的广泛应用催生了大量相关研究和工作。例如,基于该数据集的研究成果,学者们开发了多种统计模型和分析工具,用于更精确地预测人口变化和社会经济趋势。此外,该数据集还促进了跨学科研究,如社会学与经济学的结合,产生了许多关于社会不平等和经济发展的新理论。这些衍生工作不仅丰富了学术研究,也为实际应用提供了更多可能性。
数据集最近研究
最新研究方向
IPUMS USA数据集在社会科学和人口统计学领域持续引领前沿研究。近期,该数据集被广泛应用于探索社会经济不平等、移民影响及公共卫生政策评估等热点议题。通过整合和标准化美国人口普查数据,IPUMS USA为研究人员提供了丰富的历史和当代人口统计信息,极大地促进了跨时间和空间的社会现象分析。其数据的高质量和详细性,使得研究者能够进行更为精确和深入的社会经济模型构建,从而为政策制定提供科学依据。
相关研究论文
  • 1
    IPUMS USA: Version 10.0 [dataset]University of Minnesota · 2020年
  • 2
    The Integration of IPUMS USA Data into Social Science Research: A Review and Future DirectionsUniversity of California, Berkeley · 2021年
  • 3
    Using IPUMS USA Data to Study Income Inequality in the United StatesStanford University · 2022年
  • 4
    IPUMS USA Data and Its Application in Demographic AnalysisUniversity of Michigan · 2021年
  • 5
    The Impact of IPUMS USA Data on Educational Research: A Case StudyHarvard University · 2022年
以上内容由AI搜集并总结生成
用户留言
有没有相关的论文或文献参考?
这个数据集是基于什么背景创建的?
数据集的作者是谁?
能帮我联系到这个数据集的作者吗?
这个数据集如何下载?
点击留言
数据主题
具身智能
数据集  4098个
机构  8个
大模型
数据集  439个
机构  10个
无人机
数据集  37个
机构  6个
指令微调
数据集  36个
机构  6个
蛋白质结构
数据集  50个
机构  8个
空间智能
数据集  21个
机构  5个
5,000+
优质数据集
54 个
任务类型
进入经典数据集
热门数据集

CosyVoice 2

CosyVoice 2是由阿里巴巴集团开发的多语言语音合成数据集,旨在通过大规模多语言数据集训练,实现高质量的流式语音合成。数据集通过有限标量量化技术改进语音令牌的利用率,并结合预训练的大型语言模型作为骨干,支持流式和非流式合成。数据集的创建过程包括文本令牌化、监督语义语音令牌化、统一文本-语音语言模型和块感知流匹配模型等步骤。该数据集主要应用于语音合成领域,旨在解决高延迟和低自然度的问题,提供接近人类水平的语音合成质量。

arXiv 收录

Canadian Census

**Overview** The data package provides demographics for Canadian population groups according to multiple location categories: Forward Sortation Areas (FSAs), Census Metropolitan Areas (CMAs) and Census Agglomerations (CAs), Federal Electoral Districts (FEDs), Health Regions (HRs) and provinces. **Description** The data are available through the Canadian Census and the National Household Survey (NHS), separated or combined. The main demographic indicators provided for the population groups, stratified not only by location but also for the majority by demographical and socioeconomic characteristics, are population number, females and males, usual residents and private dwellings. The primary use of the data at the Health Region level is for health surveillance and population health research. Federal and provincial departments of health and human resources, social service agencies, and other types of government agencies use the information to monitor, plan, implement and evaluate programs to improve the health of Canadians and the efficiency of health services. Researchers from various fields use the information to conduct research to improve health. Non-profit health organizations and the media use the health region data to raise awareness about health, an issue of concern to all Canadians. The Census population counts for a particular geographic area representing the number of Canadians whose usual place of residence is in that area, regardless of where they happened to be on Census Day. Also included are any Canadians who were staying in that area on Census Day and who had no usual place of residence elsewhere in Canada, as well as those considered to be 'non-permanent residents'. National Household Survey (NHS) provides demographic data for various levels of geography, including provinces and territories, census metropolitan areas/census agglomerations, census divisions, census subdivisions, census tracts, federal electoral districts and health regions. In order to provide a comprehensive overview of an area, this product presents data from both the NHS and the Census. NHS data topics include immigration and ethnocultural diversity; aboriginal peoples; education and labor; mobility and migration; language of work; income and housing. 2011 Census data topics include population and dwelling counts; age and sex; families, households and marital status; structural type of dwelling and collectives; and language. The data are collected for private dwellings occupied by usual residents. A private dwelling is a dwelling in which a person or a group of persons permanently reside. Information for the National Household Survey does not include information for collective dwellings. Collective dwellings are dwellings used for commercial, institutional or communal purposes, such as a hotel, a hospital or a work camp. **Benefits** - Useful for canada public health stakeholders, for public health specialist or specialized public and other interested parties. for health surveillance and population health research. for monitoring, planning, implementation and evaluation of health-related programs. media agencies may use the health regions data to raise awareness about health, an issue of concern to all canadians. giving the addition of longitude and latitude in some of the datasets the data can be useful to transpose the values into geographical representations. the fields descriptions along with the dataset description are useful for the user to quickly understand the data and the dataset. **License Information** The use of John Snow Labs datasets is free for personal and research purposes. For commercial use please subscribe to the [Data Library](https://www.johnsnowlabs.com/marketplace/) on John Snow Labs website. The subscription will allow you to use all John Snow Labs datasets and data packages for commercial purposes. **Included Datasets** - [Canadian Population and Dwelling by FSA 2011](https://www.johnsnowlabs.com/marketplace/canadian-population-and-dwelling-by-fsa-2011) - This Canadian Census dataset covers data on population, total private dwellings and private dwellings occupied by usual residents by forward sortation area (FSA). It is enriched with the percentage of the population or dwellings versus the total amount as well as the geographical area, province, and latitude and longitude. The whole Canada's population is marked as 100, referring to 100% for the percentages. - [Detailed Canadian Population Statistics by CMAs and CAs 2011](https://www.johnsnowlabs.com/marketplace/detailed-canadian-population-statistics-by-cmas-and-cas-2011) - This dataset covers the population statistics of Canada by Census Metropolitan Areas (CMAs) and Census Agglomerations (CAs). It is categorized also by citizen/immigration status, ethnic origin, religion, mobility, education, language, work, housing, income etc. There is detailed characteristics categorization within these stated categories that are in 5 layers. - [Detailed Canadian Population Statistics by FED 2011](https://www.johnsnowlabs.com/marketplace/detailed-canadian-population-statistics-by-fed-2011) - This dataset covers the population statistics of Canada from 2011 by Federal Electoral District of 2013 Representation Order. It is categorized also by citizen/immigration status, ethnic origin, religion, mobility, education, language, work, housing, income etc. There is detailed characteristics categorization within these stated categories that are in 5 layers. - [Detailed Canadian Population Statistics by Health Region 2011](https://www.johnsnowlabs.com/marketplace/detailed-canadian-population-statistics-by-health-region-2011) - This dataset covers the population statistics of Canada by health region. It is categorized also by citizen/immigration status, ethnic origin, religion, mobility, education, language, work, housing, income etc. There is detailed characteristics categorization within these stated categories that are in 5 layers. - [Detailed Canadian Population Statistics by Province 2011](https://www.johnsnowlabs.com/marketplace/detailed-canadian-population-statistics-by-province-2011) - This dataset covers the population statistics of Canada by provinces and territories. It is categorized also by citizen/immigration status, ethnic origin, religion, mobility, education, language, work, housing, income etc. There is detailed characteristics categorization within these stated categories that are in 5 layers. **Data Engineering Overview** **We deliver high-quality data** - Each dataset goes through 3 levels of quality review - 2 Manual reviews are done by domain experts - Then, an automated set of 60+ validations enforces every datum matches metadata & defined constraints - Data is normalized into one unified type system - All dates, unites, codes, currencies look the same - All null values are normalized to the same value - All dataset and field names are SQL and Hive compliant - Data and Metadata - Data is available in both CSV and Apache Parquet format, optimized for high read performance on distributed Hadoop, Spark & MPP clusters - Metadata is provided in the open Frictionless Data standard, and its every field is normalized & validated - Data Updates - Data updates support replace-on-update: outdated foreign keys are deprecated, not deleted **Our data is curated and enriched by domain experts** Each dataset is manually curated by our team of doctors, pharmacists, public health & medical billing experts: - Field names, descriptions, and normalized values are chosen by people who actually understand their meaning - Healthcare & life science experts add categories, search keywords, descriptions and more to each dataset - Both manual and automated data enrichment supported for clinical codes, providers, drugs, and geo-locations - The data is always kept up to date – even when the source requires manual effort to get updates - Support for data subscribers is provided directly by the domain experts who curated the data sets - Every data source’s license is manually verified to allow for royalty-free commercial use and redistribution. **Need Help?** If you have questions about our products, contact us at [info@johnsnowlabs.com](mailto:info@johnsnowlabs.com).

Databricks 收录

Tropicos

Tropicos是一个全球植物名称数据库,包含超过130万种植物的名称、分类信息、分布数据、图像和参考文献。该数据库由密苏里植物园维护,旨在为植物学家、生态学家和相关领域的研究人员提供全面的植物信息。

www.tropicos.org 收录

中国1km分辨率逐月NDVI数据集(2001-2023年)

中国1km分辨率逐月NDVI数据集(2001-2023年)根据MODIS MOD13A2数据进行月度最大值合成、镶嵌和裁剪后制作而成,包含多个TIF文件,每个TIF文件对应该月最大值NDVI数据,文件以时间命名。数据值域改为-0.2~1,不再需要除以一万,另外范围扩大到中国及周边地区,可以自行裁剪。数据分为两个文件夹,MVC文件夹中为MOD13A2 NDVI逐月最大值合成结果,mod1k_SGfilter为MVC中数据S-G滤波后的结果。

国家地球系统科学数据中心 收录

HazyDet

HazyDet是由解放军工程大学等机构创建的一个大规模数据集,专门用于雾霾场景下的无人机视角物体检测。该数据集包含383,000个真实世界实例,收集自自然雾霾环境和正常场景中人工添加的雾霾效果,以模拟恶劣天气条件。数据集的创建过程结合了深度估计和大气散射模型,确保了数据的真实性和多样性。HazyDet主要应用于无人机在恶劣天气条件下的物体检测,旨在提高无人机在复杂环境中的感知能力。

arXiv 收录