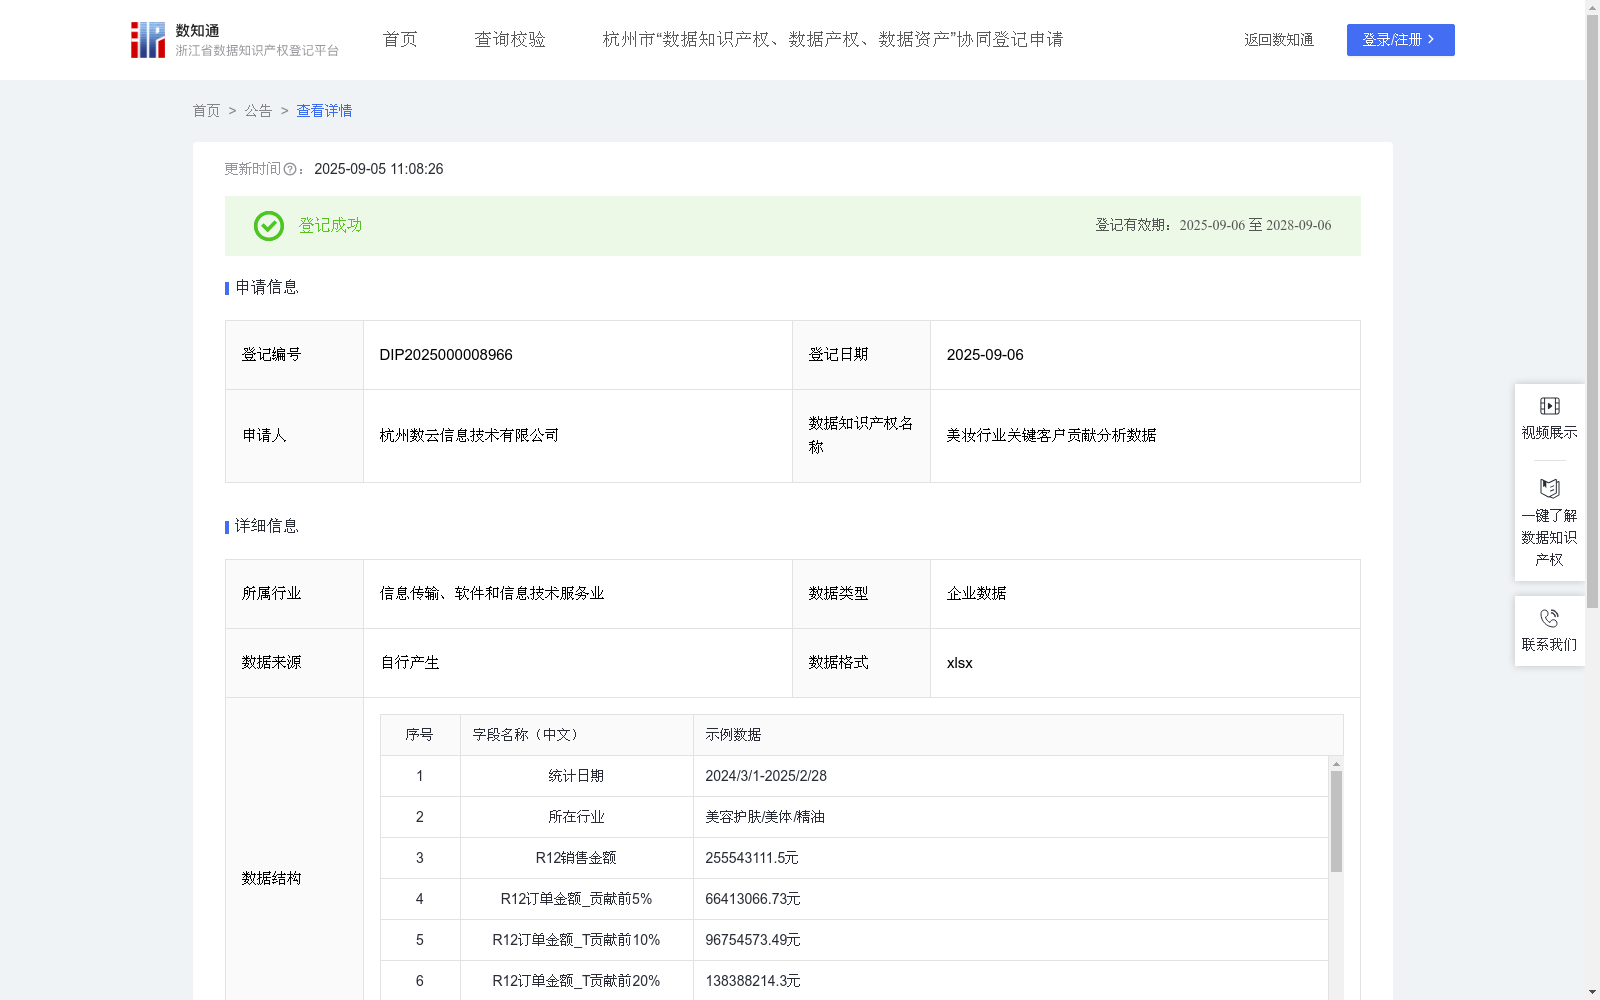
美妆行业关键客户贡献分析数据
收藏浙江省数据知识产权登记平台2025-09-05 更新2025-09-06 收录
下载链接:
https://www.zjip.org.cn/home/announce/trends/175423
下载链接
链接失效反馈官方服务:
资源简介:
此数据通过对一定规模美妆行业关键客户贡献数据的分析,帮助企业:1. 识别高价值客户:通过前5%、10%、20%客户的销售占比,快速定位核心客户群体,优化资源分配。2. 动态调整策略:环比增长数据可判断核心客户贡献是否稳定,若占比下降需预警,占比上升则验证资源倾斜策略的有效性。3. 依赖度分析:若前5%客户占比过高,反映业务过度依赖头部客户,需拓展中腰部客户以分散风险。4. 趋势预警:环比增长为负时,可能预示核心客户购买力下降或竞争加剧,需针对性复盘。 5.数据应用:定位核心客户,监控贡献变化,预警过度依赖,优化资源分配。
数据采集:
通过数云自研CRM系统采集全渠道交易数据、会员数据并进行加工。获取数据完整进行加工,单位为元。
数据加工:
1. 销售金额占比=客户_销售金额/销售金额
2. 客户_销售金额占比环比增长=R12贡献客户_销售金额占比 - R13_24贡献客户_销售金额占比
3.R12指标:指最近12个月的指标数据;R13_24指标:指往前13-24个月的指标数据。
4.数据结构中第11项-13项复购率指代的是R12,第14项-16项指代的是R13_24
This dataset is created through the analysis of large-scale key customer contribution data in the beauty industry, aiming to assist enterprises in the following aspects:
1. Identify high-value customers: Quickly locate core customer groups and optimize resource allocation by calculating the sales contribution proportions of the top 5%, 10%, and 20% of customers.
2. Dynamically adjust strategies: Use month-over-month (MoM) growth data to evaluate the stability of core customer contributions. A decline in their proportion should trigger an early warning, while an increase verifies the effectiveness of resource tilting strategies.
3. Dependency analysis: If the sales proportion of the top 5% of customers is excessively high, it indicates that the business is overly reliant on head customers, requiring the expansion of mid-tier customers to disperse operational risks.
4. Trend early warning: A negative MoM growth rate may signal a decline in core customers' purchasing power or intensified market competition, necessitating targeted reviews and adjustments.
5. Data applications: Locate core customers, monitor changes in their contributions, issue early warnings for over-reliance, and optimize resource allocation.
Data Collection:
Full-channel transaction data and member data are collected and processed via the self-developed CRM system of Shuyun. All collected data is fully processed and denominated in Chinese Yuan (CNY).
Data Processing:
1. Sales Proportion = Customer_Sales Amount / Total Sales Amount
2. Month-over-Month Growth Rate of Customer Sales Proportion = R12 Customer Sales Proportion - R13_24 Customer Sales Proportion
3. R12 indicator: Refers to the indicator data from the most recent 12 months; R13_24 indicator: Refers to the indicator data from the 13th to 24th months prior to the reference period.
4. The repurchase rates listed in items 11 to 13 of the data structure correspond to R12 indicators, while those in items 14 to 16 correspond to R13_24 indicators.
提供机构:
杭州数云信息技术有限公司
创建时间:
2025-06-24
搜集汇总
数据集介绍
以上内容由遇见数据集搜集并总结生成


