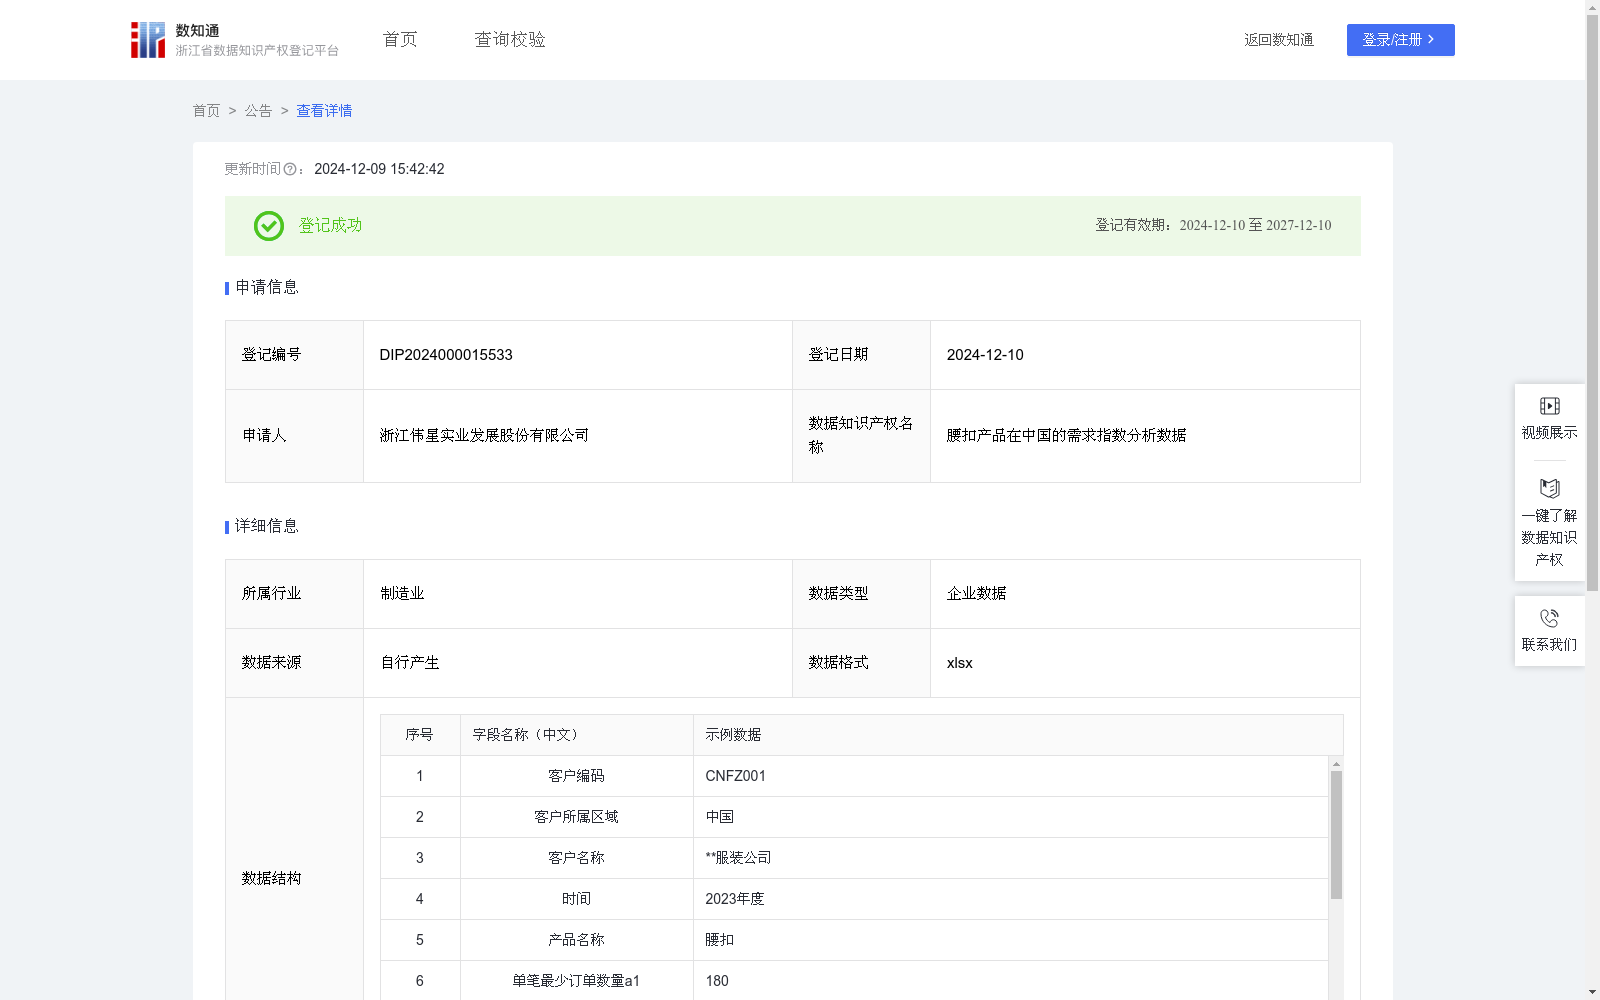
腰扣产品在中国的需求指数分析数据
收藏资源简介:
腰扣,作为一种兼具实用性和装饰性的时尚配件。材料上采用优质金属、皮革等,具有良好的耐用性,制作过程融合多种工艺技术,是时尚与实用的融合,有着较为广阔的市场前景。公司通过收集和分析目标国家区域客户对腰扣产品的需求指数相关数据,了解客户对仿皮标牌的需求量、购买力和消费偏好,以及了解该类商品在目标国家区域是否畅销,对不同级别的客户可采取不同的营销策略,从而为企业提供更为精准的生产及营销决策分析。该项数据分析对腰扣产品相关企业具有重要的参考意义,在行业内具有极佳的应用价值和极大的推广意义。1.数据采集:采集目标国家区域客户对腰扣产品的需求量的相关销售数据。 2.数据处理:对采集到数据进行分类加工、合并累加、脱敏清洗,便于分析使用。 3.数据运算:将处理后的数据按照如下算法公式进行运算:需求指数P={a1(单笔最少订单数量)/b1(单笔最少消费额)+a2(单笔最高订单数量)/b2(单笔最高消费额)+a3(平均订单数量)/b3(平均消费额)}*k,其中k为消费系数,根据目标区域的实际市场情况进行取值,按分析取k值为0.6。 4、数据分级:根据计算出的需求指数P,将客户进行分级。若P≥100,则标记为A级客户;若60≤P<100,则标记为B级客户;若20≤P<60,则标记为C级客户;若P<20,则标记为D级客户。根据客户的级别可制定相应的营销策略。
Waist buckles are fashionable accessories that integrate both practicality and decoration. Crafted from high-quality metals, leather and other materials, they exhibit excellent durability. The manufacturing process combines various craftsmanship technologies, perfectly blending fashion and practicality, thus boasting broad market prospects. An enterprise collects and analyzes data related to demand indices of waist buckle products from customers in target countries and regions, to gain insights into customers' demand volume, purchasing power and consumption preferences for imitation leather tags associated with waist buckles, as well as the market performance of such products in target regions. By formulating differentiated marketing strategies for customers at different tiers, the enterprise can provide more accurate production and marketing decision-making analysis. Such data analysis holds significant reference value for enterprises engaged in waist buckle-related businesses, and exhibits excellent application value and great promotion significance within the industry. 1. Data Collection: Collect relevant sales data concerning the demand volume of waist buckle products from customers in target countries and regions. 2. Data Processing: Perform categorization, processing, consolidation, accumulation, as well as desensitization and cleaning on the collected data to facilitate subsequent analysis and usage. 3. Data Calculation: Calculate the demand index P using the following algorithm formula: Demand Index P = {a₁ (minimum single-order quantity) / b₁ (minimum single-order consumption amount) + a₂ (maximum single-order quantity) / b₂ (maximum single-order consumption amount) + a₃ (average order quantity) / b₃ (average consumption amount)} × k Where k is the consumption coefficient, which is determined based on the actual market conditions of the target region. The analysis specifies k = 0.6. 4. Data Classification: Classify customers based on the calculated demand index P: - Grade A Customers: P ≥ 100 - Grade B Customers: 60 ≤ P < 100 - Grade C Customers: 20 ≤ P < 60 - Grade D Customers: P < 20 Corresponding marketing strategies can be formulated according to the customer's grade.