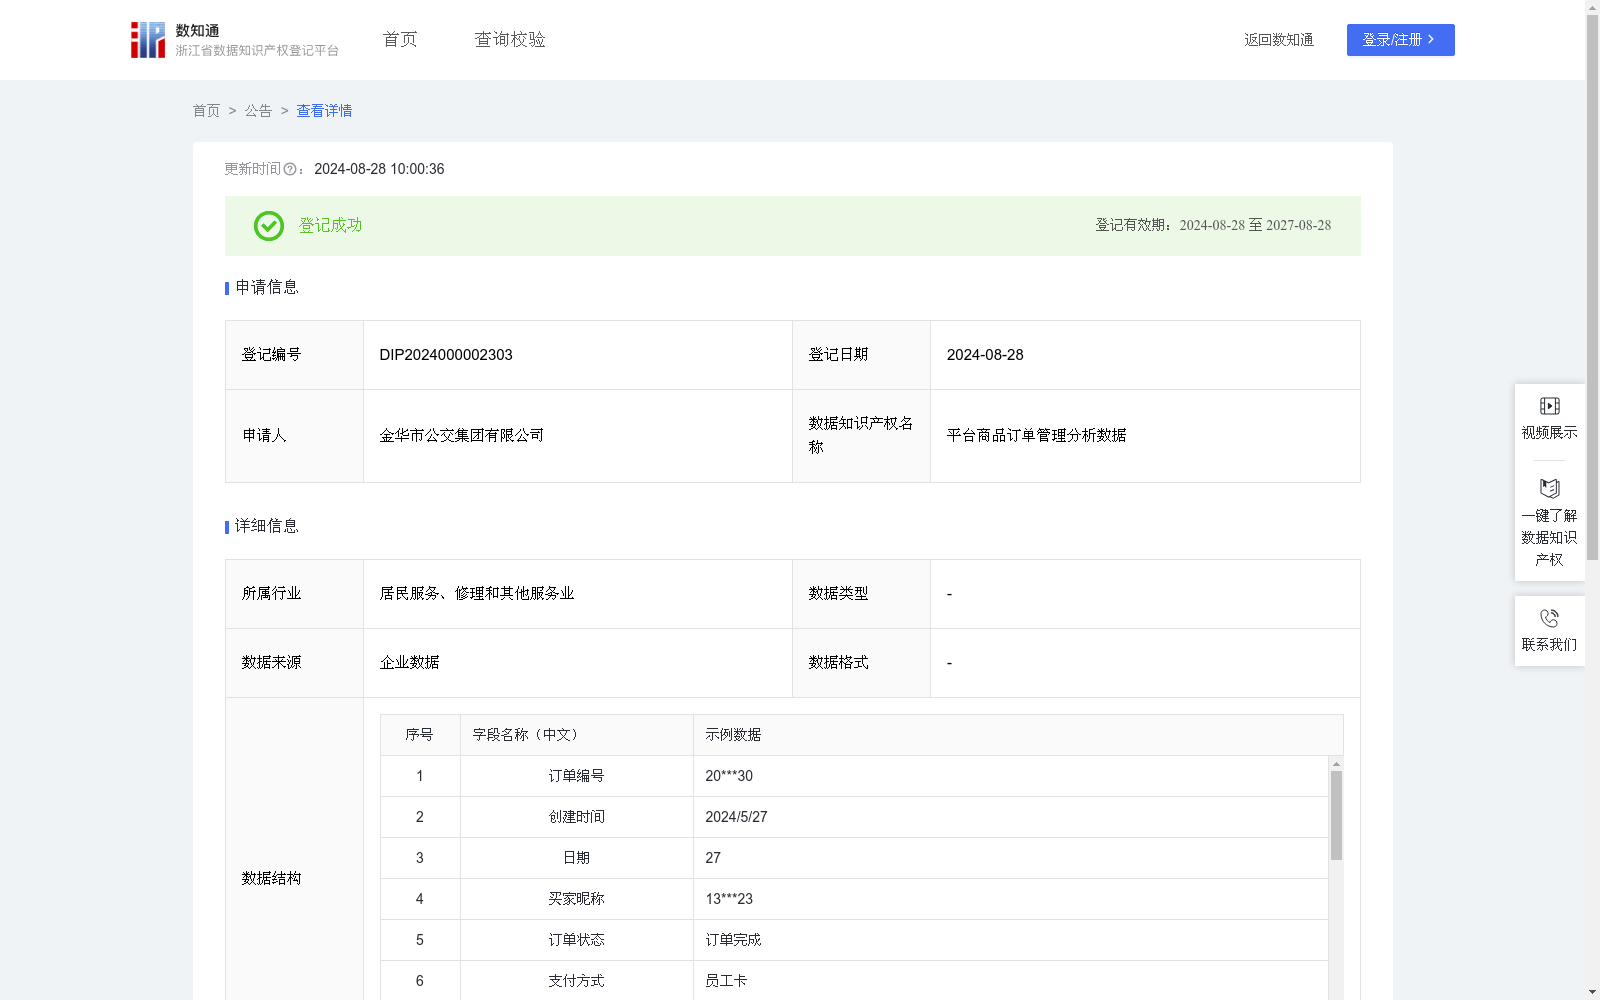
平台商品订单管理分析数据
收藏资源简介:
通过分析金华行APP某一时间段内的商品订单管理数据,掌握不同商品的交易趋势,判断不同商品的受欢迎程度,有助于平台运营管理人员优化商品库存配置策略,确保库存满足市场需求,提升运营效率。1、数据采集:通过金华行APP管理后台采集某一月份的商品订单明细数据。 2、数据处理:以订单号作为唯一标识,对数据进行清洗、去重无效数据等操作,对买家昵称进行匿名化处理。 3、数据加工:利用SUMIFS函数结合LOOKUP函数计算出单日销售金额Xn、前一日销售金额Xn-1,计算得出销售金额日环比An=(Xn-Xn-1)/Xn-1;利用SUMIFS函数计算出该商品销售金额Yn、商品销售总金额Y、该商品购买数量Zn、商品销售总数Z,计算得出该商品销售金额占比Bn=Yn/Y、该商品销售数量占比Cn=Zn/Z;根据Bn、Cn的权重核算商品受欢迎指数Dn=(Bn*70%+Cn*30%)*1000,其中Bn、Cn分别赋予70%、30%的权重。 4、数据应用:将An配合日期制成折线图展示,便于管理人员了解周期内商品交易增长趋势。由商品价格和数量核算出的商品受欢迎指数Dn越高,该商品受用户欢迎程度越高,对整体商品交易贡献越大,为后续商品进销存方案制定提供数据依据,有助于管理人员优化资源分布。
Platform operation managers can grasp the transaction trends of different commodities and evaluate their popularity by analyzing the commodity order management data of Jinhang APP within a specified time period, which helps them optimize commodity inventory allocation strategies, ensure that inventory meets market demand, and improve operational efficiency. 1. Data Collection: Detailed commodity order data for a certain month is collected through the backend management console of Jinhang APP. 2. Data Preprocessing: Taking order numbers as unique identifiers, operations including data cleaning, removal of duplicate and invalid data are conducted, and anonymization processing is performed on buyers' nicknames. 3. Data Computation: The SUMIFS and LOOKUP functions are utilized to calculate the daily sales amount Xₙ and the previous day's sales amount Xₙ₋₁, thereby deriving the daily day-on-day growth rate of sales amount Aₙ = (Xₙ - Xₙ₋₁)/Xₙ₋₁; The SUMIFS function is applied to calculate the sales amount Yₙ of a single commodity, the total sales amount Y across all commodities, the purchase quantity Zₙ of the single commodity, and the total sales quantity Z across all commodities, then the sales amount proportion Bₙ = Yₙ/Y and the sales quantity proportion Cₙ = Zₙ/Z of the single commodity are calculated; Finally, the commodity popularity index Dₙ is calculated as Dₙ = (Bₙ × 70% + Cₙ × 30%) × 1000, with 70% and 30% assigned as the respective weights for Bₙ and Cₙ. 4. Data Application: A line chart combining Aₙ and corresponding dates is created to display the commodity transaction growth trend within the cycle, facilitating managers to understand the trend. The higher the commodity popularity index Dₙ calculated based on commodity price and sales quantity, the greater the popularity of the commodity among users and its contribution to the overall commodity transaction, which provides a data basis for formulating subsequent commodity procurement, sales and inventory management plans, and helps managers optimize resource allocation.