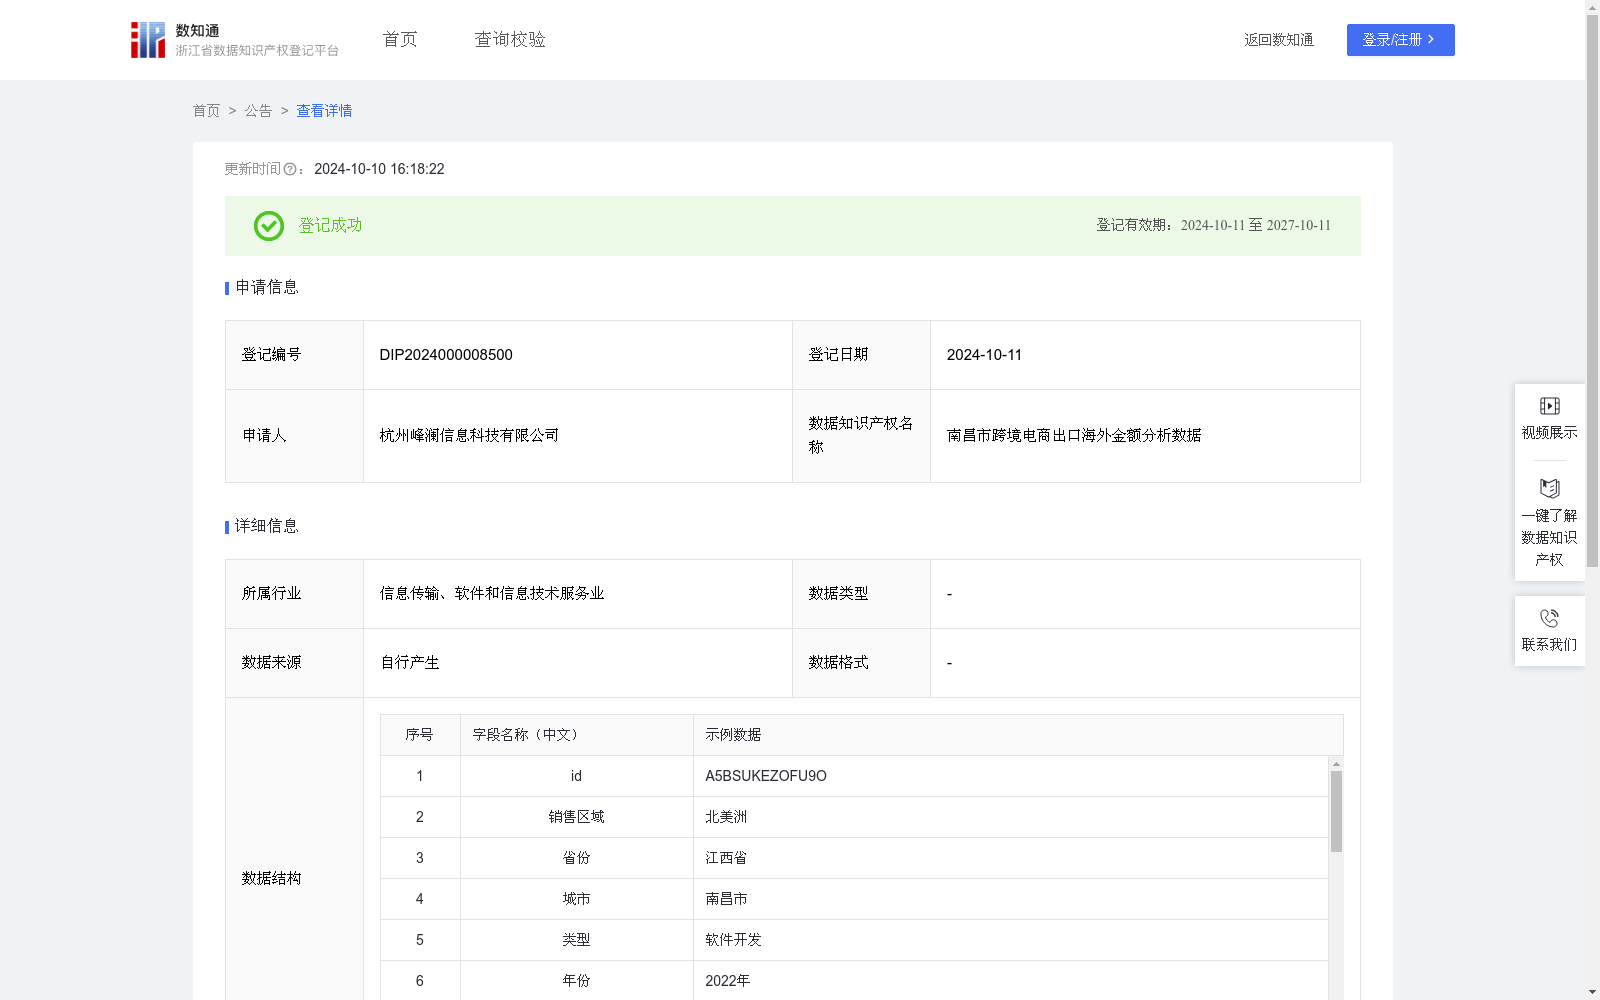
南昌市跨境电商出口海外金额分析数据
收藏资源简介:
通过系统录入的方式进行清洗、加工、汇总,汇总跨境销售每个月各区域各行业出口各个国家的出口金额,通过计算各个区域每个月出口金额的方差大小,以用来评价各个区域的出口情况,从而用于评估各区域所有企业的生产和出口策略,本行业所有企业可以通过往年数据了解本行业在该国的淡旺季,以平衡生产和出口数量。步骤1:统计跨境出口各个年度的每个月出口各个国家的出口金额(以人民币万元为单元),并依次用x1,x2...x12表示(一月出口金额=x1,x2...),并汇总计算得到当年的总出口金额=x。步骤2:计算月平均出口金额x̅=总出口金额x/12,结果取小数点后三位。步骤3:根据方差公式,计算方差s2={(x1-x̅)^2+(x2-x̅)^2+(x3-x̅)^2+…+(x12-x̅)^2}/12,结果取小数点后三位。步骤4:当方差s2小于0.5评价该国为出口超平稳型区域。当方差s大于等于0.5并且小于等于1评价该国为出口一般平稳型区域。当方差s2大于1评价该国为出口波动型区域。对于出口超平稳型区域,本行业所有企业无需时时关注该国行情,可每月保持好产品的生产和出口数量;对于出口一般平稳型区域,本行业所有企业需每季度关注该国行情,适应调整产品的生产和出口数量;而对于出口波动型区域,本行业所有企业需每月关注该国行情,了解淡旺季情况变化,大幅度调整产品的生产和出口数量
This dataset is cleaned, processed and aggregated via systematic data entry, compiling the monthly export values (in ten thousand RMB) of each industry across different regions to various countries for cross-border sales. By calculating the variance of monthly export values for each region, we evaluate the export performance of different regions, which is further used to assess the production and export strategies of all enterprises in each region. Enterprises in the same industry can leverage historical data to understand the peak and off-peak seasons of their industry in specific countries, so as to balance production and export volumes. The specific processing steps are as follows: Step 1: Calculate the monthly export values (in ten thousand RMB) to various countries for cross-border exports in each year, denote them as x₁, x₂, ..., x₁₂ sequentially (where x₁ represents the export value in January, and so on), and aggregate them to obtain the total annual export value denoted as x. Step 2: Calculate the monthly average export value x̄ = total annual export value x / 12, retain three decimal places for the result. Step 3: Calculate the variance s² using the standard variance formula: s² = [(x₁ - x̄)² + (x₂ - x̄)² + (x₃ - x̄)² + … + (x₁₂ - x̄)²] / 12, retain three decimal places for the result. Step 4: Classify the export status of each region based on the calculated variance s²: 1. Ultra-stable Export Region: when s² < 0.5; 2. Generally Stable Export Region: when 0.5 ≤ s² ≤ 1; 3. Volatile Export Region: when s² > 1. For enterprises in the same industry: - For Ultra-stable Export Regions: there is no need to pay constant attention to local market trends, and enterprises can maintain stable product production and export volumes on a monthly basis; - For Generally Stable Export Regions: enterprises need to monitor local market trends every quarter and adjust product production and export volumes accordingly; - For Volatile Export Regions: enterprises need to monitor local market trends monthly, grasp changes in peak and off-peak seasons, and make substantial adjustments to product production and export volumes.