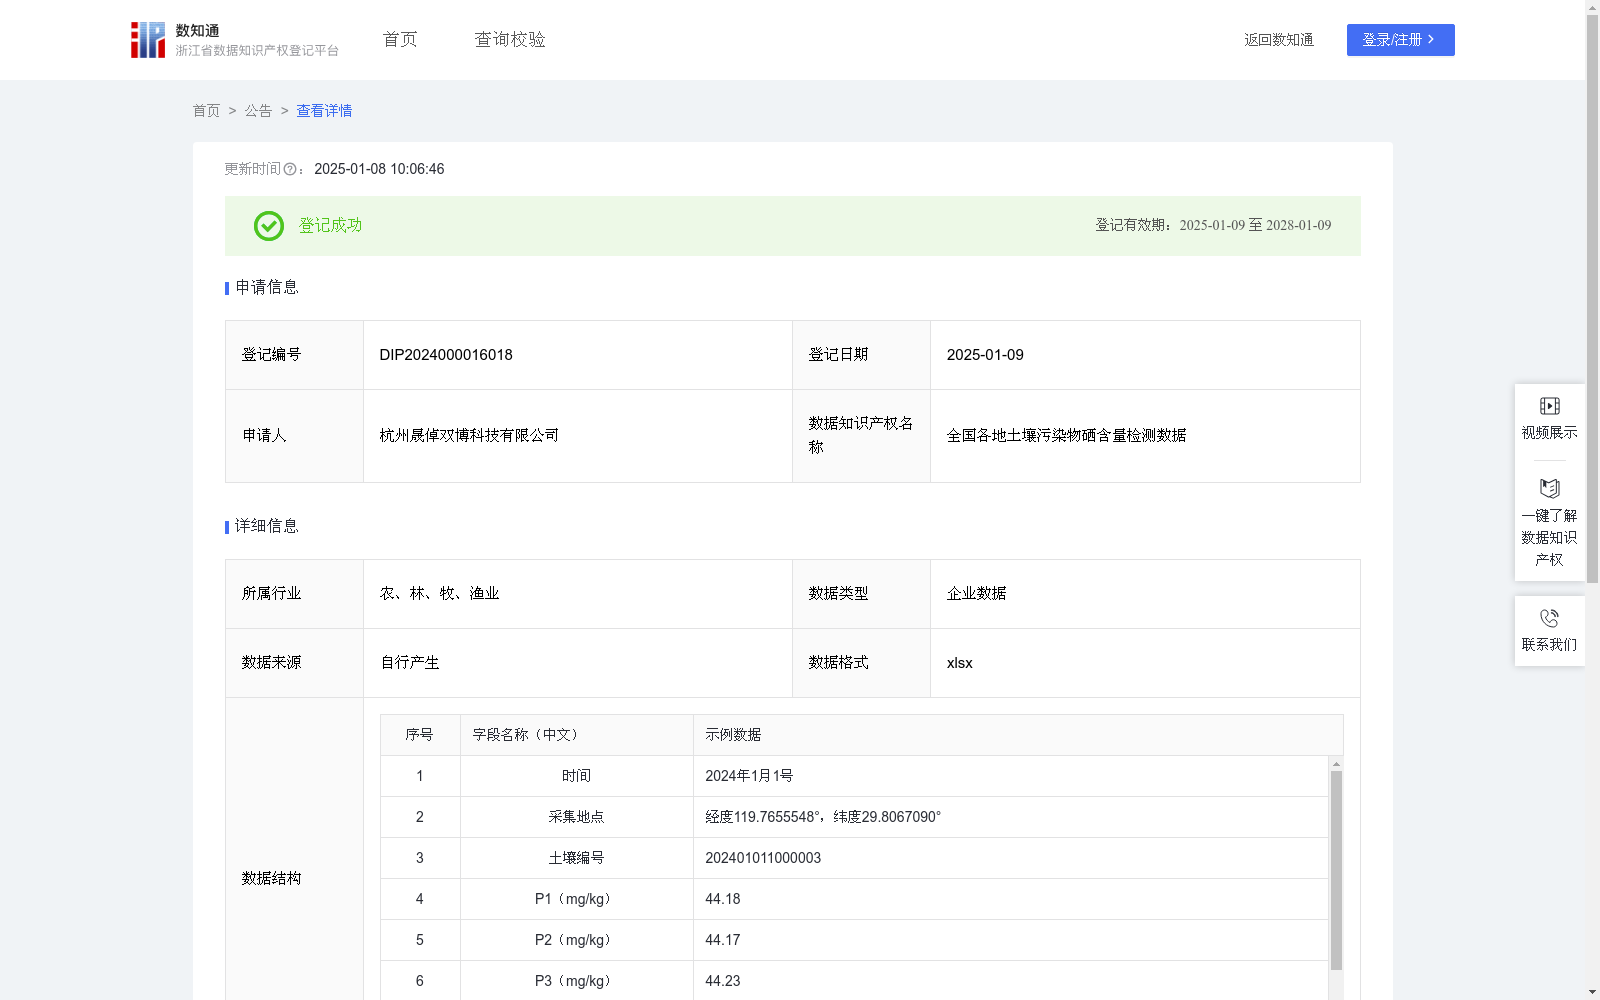
全国各地土壤污染物硒含量检测数据
收藏资源简介:
通过检测数据分析研判,我们可以判断全国各地土壤污染物中硒是否超标,避免因硒持续污染而产生的污染问题,有以下几点作用。一、进行土壤污染治理可以减少农作物中的该有害物质含量,确保食品的质量和安全;二、根据检测结果可有针对的改善士壤质量,提高土壤的生产力,可以为农业发展提供可持续的基础,同时也有利于保护和改善环境。另外可结合地理信息系统(GIS)技术,将各地点的土壤地理数据和硒污染物含量信息进行深度整合和分析,绘制地理位置-污染物含量地图,以直观的可视化形式呈现给用户,增强地理位置与污染物含量关系的理解,构建起一个包含污染源、污染物种类、污染程度、污染扩散路径等多维度信息的地理图谱。这一图谱不仅能够提供实时的监测数据,还能够通过数据之间的关联性,揭示潜在的污染风险和趋势。1数据采集:每天对全国各地的各个地点,在各个地点的方圆1米直径内随机采集3个点的土壤;2数据处理:将数据去噪、优化、补全;3数据加工:通过检测仪设备对3个点的土壤进行硒污染物含量检测,得出3个采样点的土壤硒污染物含量数据,分别为P1、P2和P3,则该地点的土壤硒污染物含量平均值P4=(P1+P2+P3)/3,3个采样点硒的含量方差s^2={(P1-P4)^2+(P2-P4)^2+(P3-P4)^2}/3;4数据应用:根据土壤硒污染物含量平均值P4有助于了解该地区土壤中硒的污染状况和潜在的污染风险趋势,若s^2大于0.001则该采集地点为异常,否则为不异常,对于异常的采集地点,需重点关注,查找出引起异常的原因。
Through data analysis and assessment based on detection results, we can determine whether selenium in soil pollutants across the country exceeds the standard, and prevent pollution issues caused by continuous selenium contamination. This dataset has the following functions: First, conducting soil pollution remediation can reduce the content of this harmful substance in crops, ensuring food quality and safety. Second, targeted improvement of soil quality can be carried out based on test results, enhancing soil productivity, providing a sustainable foundation for agricultural development, and simultaneously contributing to environmental protection and improvement. In addition, by integrating Geographic Information System (GIS) technology, we can conduct in-depth integration and analysis of soil geographic data and selenium pollutant concentration information from various locations, and draw a location-pollutant concentration map. Presented to users in an intuitive visual format, this map enhances understanding of the relationship between geographic locations and pollutant concentrations, and constructs a geographic knowledge graph containing multi-dimensional information such as pollution sources, pollutant types, pollution degrees, and pollution diffusion paths. This graph not only provides real-time monitoring data, but also reveals potential pollution risks and trends through the correlation between different datasets. The workflow of this dataset is as follows: 1. Data Collection: Randomly collect soil samples from 3 points within a 1-meter diameter circle at each location across the country every day. 2. Data Processing: Perform denoising, optimization, and data imputation on the collected data. 3. Data Analysis: Detect the selenium pollutant concentration in the soil samples from the 3 points using testing equipment, obtaining the selenium concentration data of the three sampling points, denoted as P1, P2, and P3 respectively. Then, the average selenium pollutant concentration of soil at this location is P4 = (P1 + P2 + P3)/3, and the variance of selenium concentrations in the three sampling points is s² = [(P1-P4)² + (P2-P4)² + (P3-P4)²]/3. 4. Data Application: The average selenium pollutant concentration P4 helps understand the selenium pollution status and potential pollution risk trends of soil in this area. If the variance s² is greater than 0.001, the sampling location is deemed abnormal; otherwise, it is normal. Abnormal sampling locations require close attention to identify the causes of the anomaly.