
Figure 3
收藏官方服务:
资源简介:
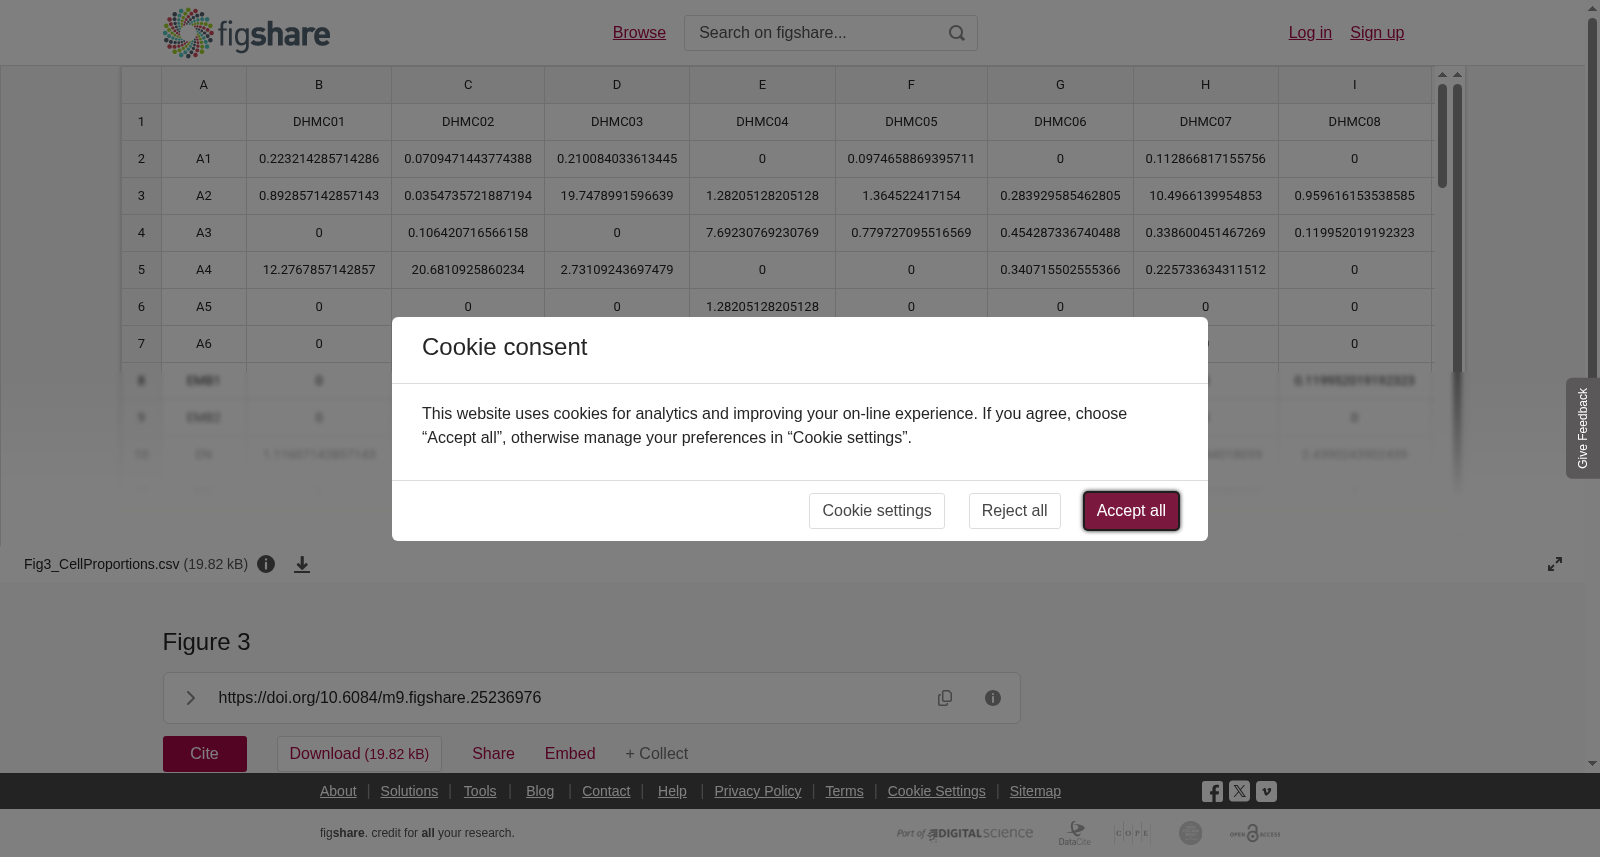
<b>Figure 3.</b> <b>Tumor type-specific presence of cell types. </b>Heatmap of the proportions (%) of each cell type present in each sample. Scatter plot on the left of the heatmap indicates the median stemness level of each cell type. Horizontal tracking bars indicate the tumor type and grade of each sample. Vertical tracking bars indicate the major cell types of the nuclei. The cell types with greater than 5% are labeled within each cell. ATC: Astrocytoma; EMB: Embryonal tumors; EPN: Ependymoma; GBM: Glioblastoma; GNN: Glioneuronal/neuronal tumors; NT: Non-tumor; SCH: Schwannoma.
提供机构:
figshare创建时间:
2024-02-18
搜集汇总
数据集介绍
以上内容由遇见数据集搜集并总结生成


