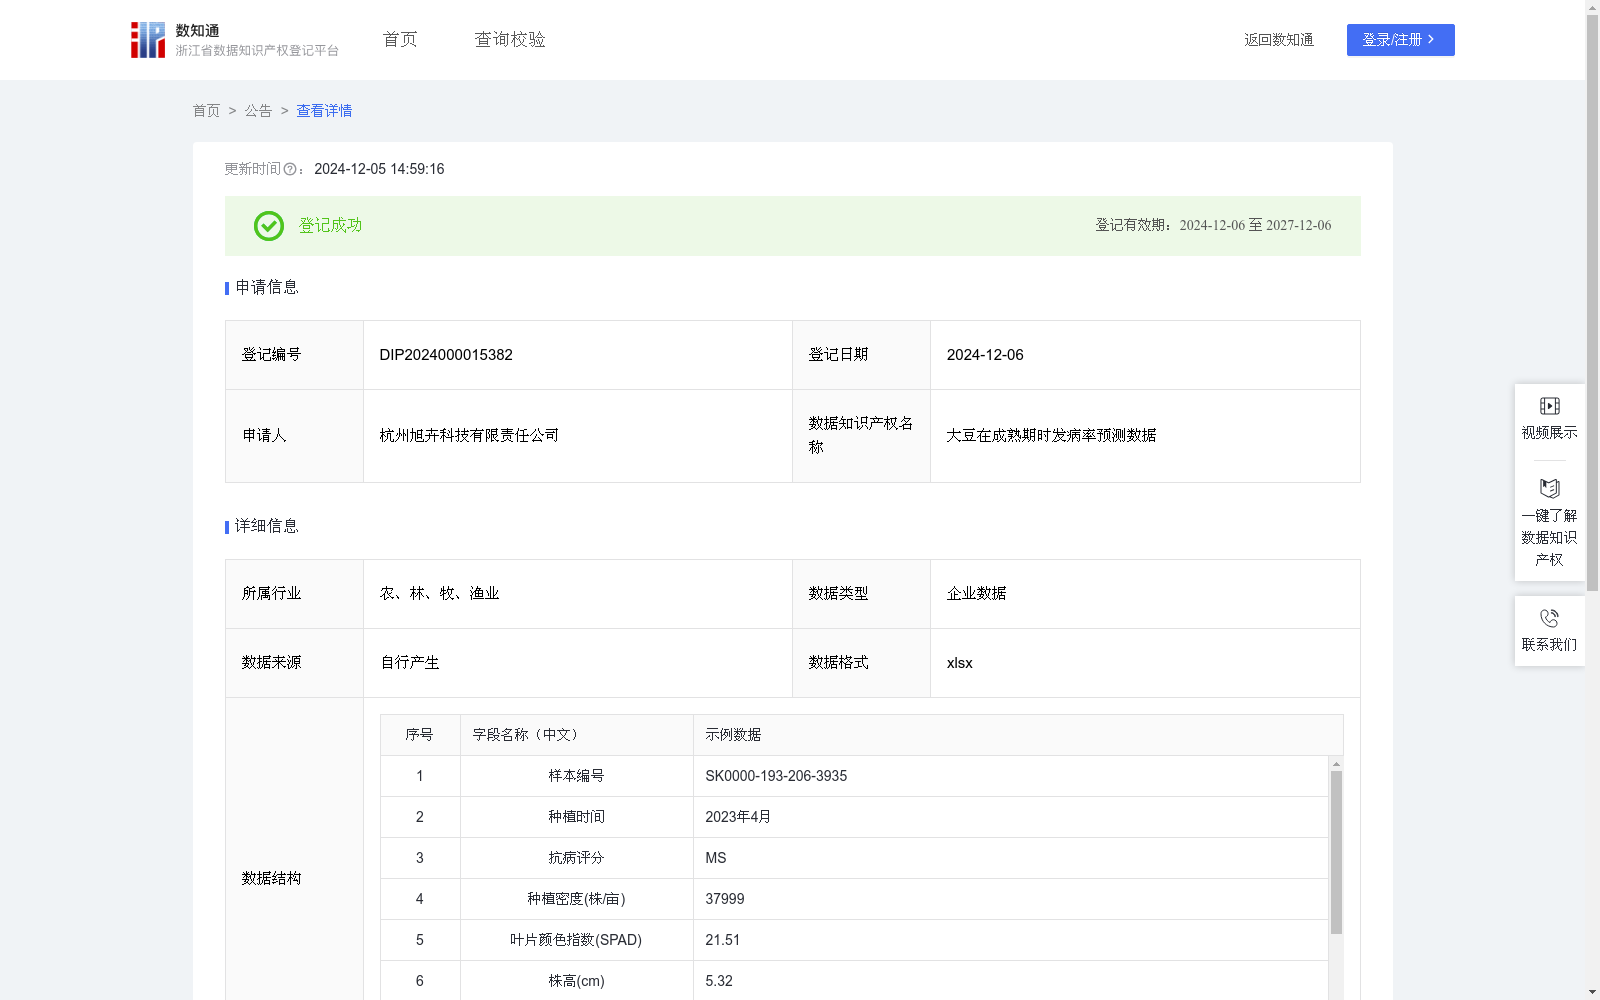
大豆在成熟期时发病率预测数据
收藏浙江省数据知识产权登记平台2024-12-05 更新2024-12-06 收录
下载链接:
https://www.zjip.org.cn/home/announce/trends/96963
下载链接
链接失效反馈官方服务:
资源简介:
可以用于大豆种植发病率预测,输入量为抗病评分、种植密度、叶片颜色指数(SPAD)、株高(cm)、病虫害类型、生育期(天)、分蘖数。输出为发病率预测值。该模型帮助解决了大豆发病率和大豆状况的关系建模的问题,对于预测发病率过高则农民可以采取相应的措施来优化种植策略,降低大豆种植发病率。大豆发病率的高低不仅仅是农业生产的考核指标,更是反映了某个地区农业生产和农业经济状况的重要指标。发病率的高低直接关系到农民的收入和粮食生产能力,对于农村的经济发展、人民生活水平的提高以及国家的农业安全都有着重要的影响。因此,降低大豆种植发病率不仅仅是农民个人利益的追求,更是国家和社会对于农业生产发展的重视。通过调查采集大豆数据,并使用传统算法和多元线性回归算法预测大豆发病率。该模型的输入为抗病评分、种植密度、叶片颜色指数(SPAD)、株高(cm)、病虫害类型、生育期(天)、分蘖数。多元线性回归算法通过分析这些输入变量与大豆发病率之间的线性关系,确定每个变量的权重系数。在模型训练过程中,算法会利用大豆发病率实际值进行优化,调整权重系数以最小化预测误差。模型通过最小二乘法等技术,根据输入的数据计算大豆发病率预测值,从而得出最终结果。通过这样的过程,模型能够将多个输入变量综合考虑,准确预测大豆发病率,提高农民的收入和粮食生产能力。
This dataset is designed for soybean planting incidence rate prediction. Its input variables cover disease resistance score, planting density, leaf color index (SPAD), plant height (cm), pest and disease type, growth period (days), and tiller number, with the output being the predicted incidence rate value.
This model solves the problem of modeling the correlation between soybean incidence rate and soybean growth status. If the predicted incidence rate is excessively high, farmers can adopt corresponding measures to optimize planting strategies and reduce soybean planting incidence rate.
Soybean incidence rate serves not only as an assessment indicator for agricultural production, but also as a critical indicator reflecting the agricultural production and economic conditions of a region. The level of incidence rate is directly linked to farmers' income and food production capacity, exerting a significant impact on rural economic development, improvement of residents' living standards, and national agricultural security. Therefore, reducing soybean planting incidence rate is not only a pursuit of individual farmers' interests, but also a priority for national and social attention to agricultural development.
Soybean-related data were collected via field surveys, and traditional algorithms and multiple linear regression algorithms were applied to predict soybean incidence rate. The model adopts the aforementioned set of input variables: disease resistance score, planting density, leaf color index (SPAD), plant height (cm), pest and disease type, growth period (days), and tiller number.
The multiple linear regression algorithm analyzes the linear relationship between these input variables and soybean incidence rate to determine the weight coefficient for each variable. During model training, the algorithm leverages the actual soybean incidence rate values for optimization, adjusting the weight coefficients to minimize prediction errors. Using techniques such as ordinary least squares, the model calculates the predicted soybean incidence rate value based on the input data to generate the final result.
Through this process, the model comprehensively considers multiple input variables to accurately predict soybean incidence rate, thereby enhancing farmers' income and food production capacity.
提供机构:
杭州旭卉科技有限责任公司
创建时间:
2024-11-12
搜集汇总
数据集介绍
特点
该数据集由杭州旭卉科技有限责任公司提供,包含4213条记录,每月更新。数据集用于预测大豆成熟期的发病率,输入变量包括抗病评分、种植密度、叶片颜色指数等,输出为发病率预测值。通过多元线性回归算法,模型能够综合考虑多个变量,准确预测发病率,帮助农民优化种植策略,降低发病率。
以上内容由遇见数据集搜集并总结生成


