
Bilateral international migration flow estimates
收藏DataCite Commons2025-05-01 更新2025-05-07 收录
下载链接:
https://figshare.com/articles/dataset/Bilateral_international_migration_flow_estimates_for_200_countries_1990-1995_to_2010-2015_/7731233/8
下载链接
链接失效反馈官方服务:
资源简介:
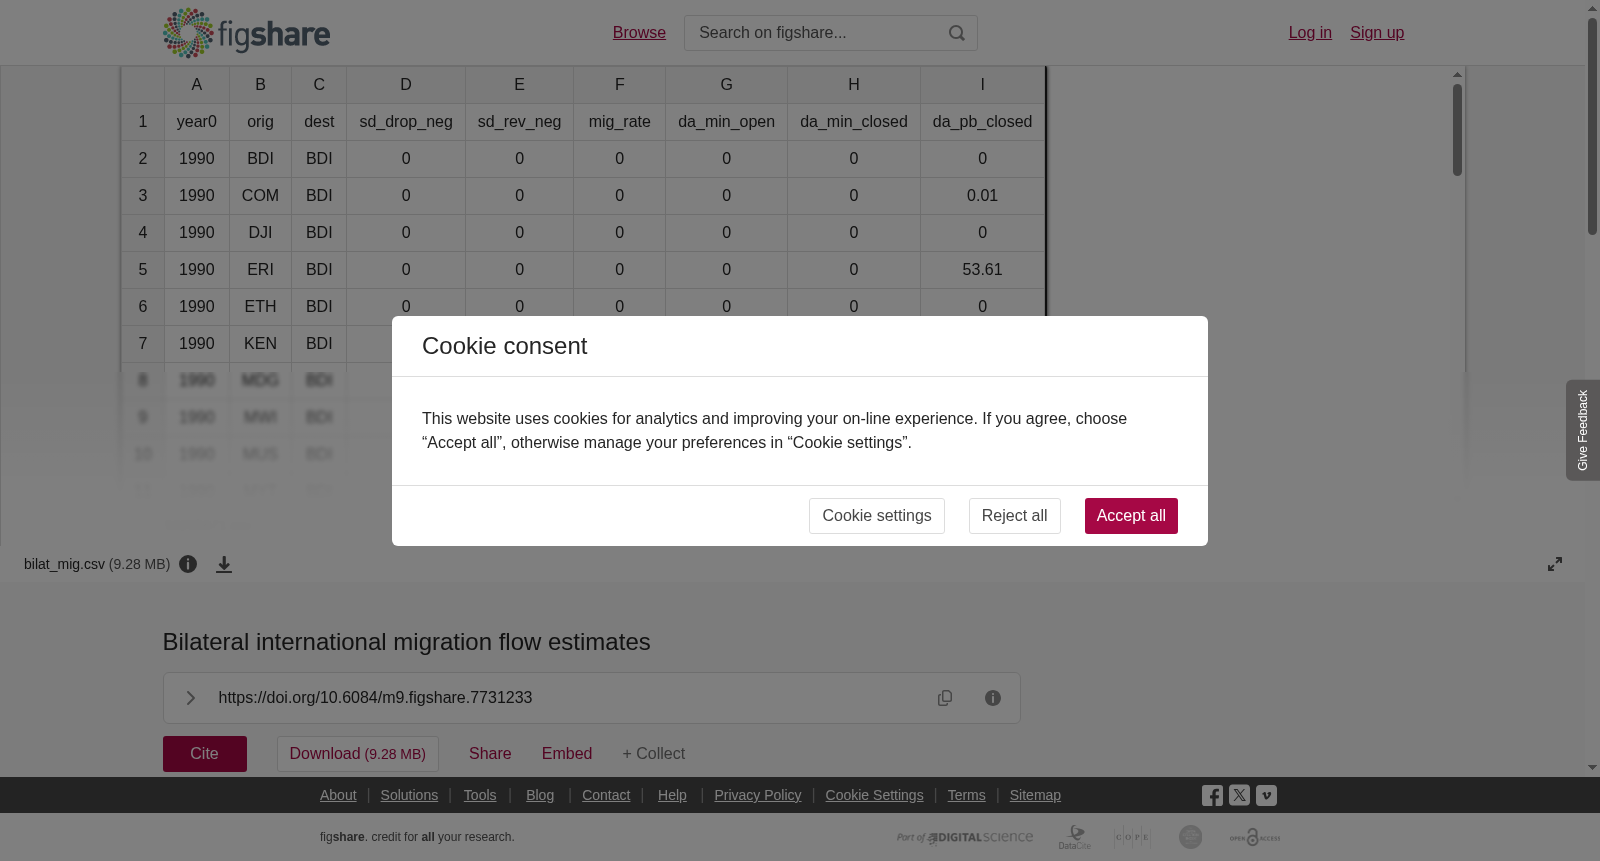
Estimates of bilateral international migration flows between 1990-1995 and 2015-2020 based on methods presented in Abel & Cohen (2019).<br>See the Figshare collection for other files, including additional bilateral estimates by type of move (outward migration, return migration, and transit migration).<br>You might also be interested in files for sex-specific bilateral international migration flow estimates, provided in another Figshare collection.<br>DownloadUse the download button above for the CSV file or run the code below to directly bring into R:<code>library(readr)<br>f <- read_csv("https://figshare.com/ndownloader/files/53235671")</code><br>Version DetailsUpdate of estimates of international migration flows from Abel & Cohen (2019) based on the most recent published UN DESA International Migrant Stock (IMS2024) and World Population Prospects (WPP2024) data inputs. Refer to Version 1 (link above) for the estimates presented in the paper, based on WPP2017 and IMS2017.A description of the changes between each version of the estimates can be found here.<br>Data DetailsRow for each migration corridor-period combination (228 origins × 228 destinations × 4 periods + 230 origins × 230 destinations × 2 periods = 313,736).Three columns for each of the data dimensions: <code>year0</code> First year of five-year period <code>orig</code> Origin ISO three letter country code <code>dest</code> Destination ISO three letter country See the county list file for country names corresponding to the ISO three letter country codes.<br>Six columns of estimated flows from six different flow-from-stock estimation method: <code>sd_drop_neg</code> Stock differencing, drop negative values <code>sd_rev_neg</code> Stock differencing, reverse negative values to counterflow <code>mig_rate</code> Migration rates method <code>da_min_open</code> Demographic accounting, minimize migrant transitions (maximize stayers) - open accounting system <code>da_min_closed</code> Demographic accounting, minimize migrant transitions (maximize stayers) - closed accounting system <code>da_pb_closed</code> Demographic accounting, pseudo-Bayesian average of migrant transitions and stayers - closed accounting system Refer to the published paper for detailed information on each method and usage notes.<br>
本数据集基于Abel与Cohen(2019)提出的方法,估算了1990-1995年至2015-2020年期间的双边国际移民流量。
可访问Figshare(Figshare)知识库获取其他相关文件,其中包含按迁移类型划分的额外双边移民流量估算结果,涵盖向外移民、回流移民及过境移民三类。
您亦可关注另一Figshare知识库中提供的按性别划分的双边国际移民流量估算文件。
下载方式:点击上方下载按钮获取CSV文件,或运行以下代码直接将数据导入R语言环境:
<code>library(readr)
f <- read_csv("https://figshare.com/ndownloader/files/53235671")</code>
版本说明:本数据集基于最新发布的联合国经济和社会事务部(UN DESA)国际移民存量(IMS2024)与世界人口展望(WPP2024)数据,对Abel与Cohen(2019)提出的国际移民流量估算方法进行了更新。基于WPP2017与IMS2017数据的论文版估算结果,请参阅版本1(上方链接)。
各版本估算结果的更新说明可在此处查阅。
数据详情:数据集每行对应一个移民走廊-时段组合,具体为(228个起源国 × 228个目的国 × 4个时段)+(230个起源国 × 230个目的国 × 2个时段)= 313,736条记录。
数据集包含三类数据维度字段:<code>year0</code>:五年时段的起始年份;<code>orig</code>:起源国ISO 3字母国家代码(ISO three letter country code);<code>dest</code>:目的国ISO 3字母国家代码(ISO three letter country code)。ISO 3字母国家代码对应的国家名称,请参阅国家列表文件。
数据集包含6列基于6种不同的存量-流量估算方法得到的移民流量估算值:
<code>sd_drop_neg</code>:存量差分法,剔除负值;
<code>sd_rev_neg</code>:存量差分法,将负值转换为反向流量;
<code>mig_rate</code>:移民迁移率法;
<code>da_min_open</code>:人口统计核算(开放核算体系),最小化移民迁移量(最大化留守人口);
<code>da_min_closed</code>:人口统计核算(封闭核算体系),最小化移民迁移量(最大化留守人口);
<code>da_pb_closed</code>:人口统计核算(封闭核算体系),基于移民迁移与留守人口的伪贝叶斯平均法。各类方法的详细说明与使用注意事项,请参阅已发表的论文。
提供机构:
figshare创建时间:
2025-03-26
搜集汇总
数据集介绍
背景与挑战
背景概述
该数据集提供了1990-2020年间全球双边国际移民流动的估计数据,涵盖多个时期和国家的流动情况,并采用六种不同的统计方法进行估计。数据基于最新的国际移民和人口统计数据,适用于人口学、经济学和社会学等领域的研究。
以上内容由遇见数据集搜集并总结生成


